官网:
参考:
gcov is a test coverage program. Use it in concert with GCC to analyze your programs to help create more efficient, faster running code and to discover untested parts of your program. You can use gcov as a profiling tool to help discover where your optimization efforts will best affect your code. You can also use gcov along with the other profiling tool, gprof, to assess which parts of your code use the greatest amount of computing time.
Profiling tools help you analyze your code’s performance. Using a profiler such as gcov or gprof, you can find out some basic performance statistics, such as:
how often each line of code executes
what lines of code are actually executed
how much computing time each section of code uses
Once you know these things about how your code works when compiled, you can look at each module to see which modules should be optimized. gcov helps you determine where to work on optimization.
gcov是什么:
-
gcov是一个测试代码覆盖率的工具。与GCC一起使用来分析程序,以帮助创建更高效、更快的运行代码,并发现程序的未测试部分。
-
是一个命令行方式的控制台程序。需要结合lcov,gcovr等前端图形工具才能实现统计数据图形化。
-
伴随GCC发布,不需要单独下载gcov工具。配合GCC共同实现对c/c++文件的语句覆盖和分支覆盖测试。
-
与程序概要分析工具(profiling tool,例如gprof)一起工作,可以估计程序中哪段代码最耗时。
gcov能做什么:
使用象gcov或gprof这样的分析器,您可以找到一些基本的性能统计数据:
-
每一行代码执行的频率是多少。
-
实际执行了哪些行代码,配合测试用例达到满意的覆盖率和预期工作。
-
每段代码使用了多少计算时间,从而找到热点优化代码。
-
gcov创建一个sourcefile.gcov的日志文件,此文件标识源文件sourcefile.c每一行执行的次数,您可以与gprof一起使用这些日志文件来帮助优化程序的性能。gprof提供了您可以使用的时间信息以及从gcov获得的信息。
1. 准备代码test.c
#include <stdio.h>


int main(int argc, char** argv)
{
    int i, total;

    total = 0;

    for(i = 0; i < 10; i++) {
        total += i;
    }

    if(total != 45) {
        printf("fail!\n");
    } else {
        printf("success!\n");
    }

    return 0;
}
2. 编译
执行:gcc -fprofile-arcs -ftest-coverage test.c -o test
生成:test.gcno和test,
baoli@ubuntu:~/tools/gcov$ ls
test test.c test.gcno
-fprofile-arcs -ftest-coverage告诉编译器生成gcov需要的额外信息,并在目标文件中插入gcov需要的extra profiling information。因此,该命令在生成可执行文件test的同时生成test.gcno文件(gcov note文件)。
3. 执行test收集信息,产生test.gcda
baoli@ubuntu:~/tools/gcov$ ls
test test.c test.gcda test.gcno
4. 执行gcov test.c,生成报告test.c.gcov
baoli@ubuntu:~/tools/gcov$ gcov test.c
File 'test.c'
Lines executed:87.50% of 8
Creating 'test.c.gcov'
baoli@ubuntu:~/tools/gcov$ ls
test test.c test.c.gcov test.gcda test.gcno
查看test.c.gcov报告信息:
baoli@ubuntu:~/tools/gcov$ cat test.c.gcov
        -:    0:Source:test.c
        -:    0:Graph:test.gcno
        -:    0:Data:test.gcda
        -:    0:Runs:1
        -:    0:Programs:1
        -:    1:#include <stdio.h>
        -:    2:
        -:    3:
        1:    4:int main(int argc, char** argv)
        -:    5:{
        -:    6:    int i, total;
        -:    7:
        1:    8:    total = 0;
        -:    9:
       11:   10:    for(i = 0; i < 10; i++) {
       10:   11:        total += i;
        -:   12:    }
        -:   13:
        1:   14:    if(total != 45) {
    #####:   15:        printf("fail!\n");
        -:   16:    } else {
        1:   17:        printf("success!\n");
        -:   18:    }
        -:   19:
        1:   20:    return 0;
        -:   21:}
其中#####表示未运行的行
每行前面的数字表示行运行的次数
5. lcov
上述生成的.c.gcov文件可视化成都较低,需要借助lcov,genhtml工具直接生成html报告。
5.1 安装lcov
sudo apt-get install lcov
5.2 运行lcov,生成相应信息
执行:lcov -d . -o test.info -b . -c
baoli@ubuntu:~/tools/gcov$ lcov -d . -o test.info -b . -c
Capturing coverage data from .
Found gcov version: 5.4.0
Scanning . for .gcda files ...
Found 1 data files in .
Processing test.gcda
Finished .info-file creation

baoli@ubuntu:~/tools/gcov$ ls
test  test.c  test.gcda  test.gcno  test.info
5.3 生成web可视化信息
执行:genhtml -o result test.info
baoli@ubuntu:~/tools/gcov$ genhtml -o result test.info
Reading data file test.info
Found 1 entries.
Found common filename prefix "/home/baoli/tools"
Writing .css and .png files.
Generating output.
Processing file gcov/test.c
Writing directory view page.
Overall coverage rate:
  lines......: 87.5% (7 of 8 lines)
  functions..: 100.0% (1 of 1 function)

baoli@ubuntu:~/tools/gcov$ ls
result  test  test.c  test.gcda  test.gcno  test.info
5.4 查看web
1)打开index.html

2)详细信息:
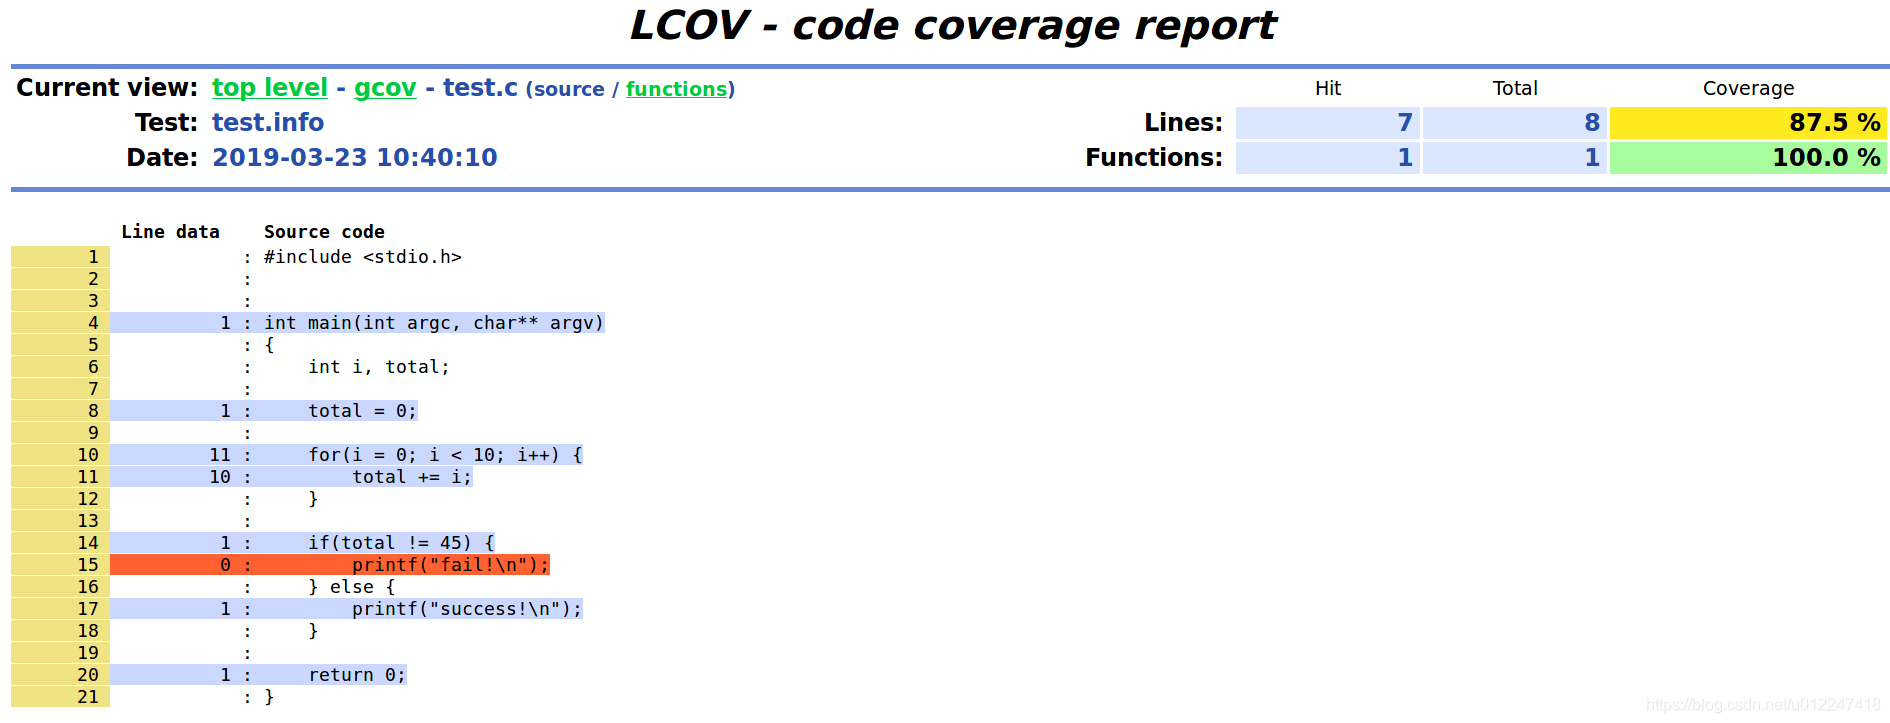
上述界面包含:
-
函数覆盖率(执行率)
-
代码行数覆盖率(执行率)
-
语句执行次数
-
源码级的详细信息