Python学习手册:
这个系列的博文是从北大tensorflow学习笔记里截出来的专门学python高级用法的日志,有在学的零基础可以看,想提高python的也可以
也欢迎大家去看tf系列的代码,我的博文里会更这个系列
1.python语法:列表推导式
2.numpy 一些函数
3.matplotlib 一些函数
4.matplotlib 高阶函数
5.queue多线程同步函数
如有一些涉及函数不懂,可以参考前几篇的学习手册
1.legend 图例
先给大家科普一下,什么是图例:
图例是集中于地图一角或一侧的地图上各种符号和颜色所代表内容与指标的说明,有助于更好
的认识地图。
在数值分析领域,图例有点是右上角那个
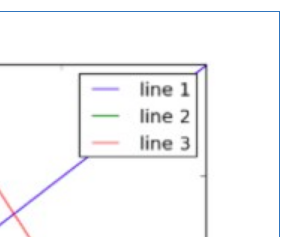
legend函数参数解释
matplotlib.pyplot.legend(*args, **kwargs)
(1)设置图例位置
使用loc参数
plt.legend(loc=‘lower left’)
0: ‘best’
1: ‘upper right’
2: ‘upper left’
3: ‘lower left’
4: ‘lower right’
5: ‘right’
6: ‘center left’
7: ‘center right’
8: ‘lower center’
9: ‘upper center’
10: ‘center’
(2)设置图例字体
#设置字体大小
fontsize : int or float or {‘xx-small’, ‘x-small’, ‘small’, ‘medium’, ‘large’, ‘x-large’, ‘xx-large’}
(3)设置图例标题
plt.legend(loc=‘best’,title=‘figure 1 legend’) #去掉图例边框
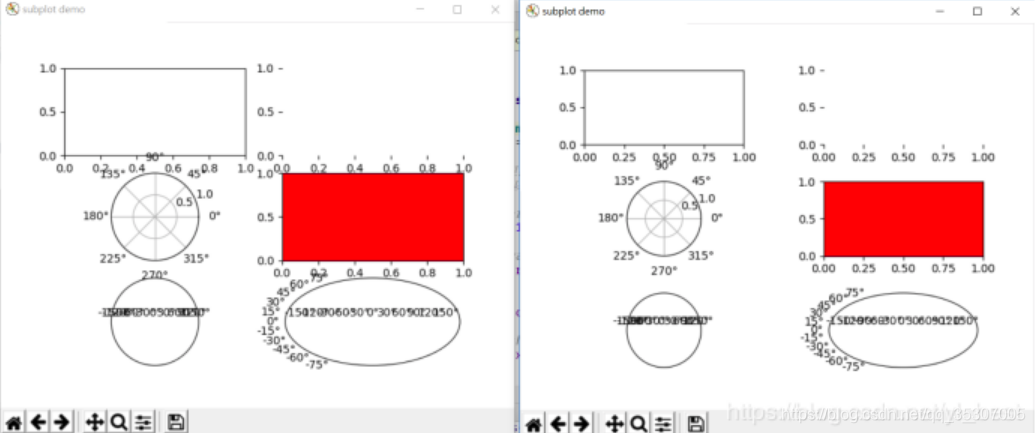
2.plt.subplots_adjust()
调整边距和子图的间距
subplots_adjust(self, left=None, bottom=None, right=None, top=None,
wspace=None, hspace=None)
对比subplot(左)和 adjsubplot (右)的实验效果