目录
一、服务监控hystrixDashboard
1、概述
除了隔离依赖服务的调用以外,Hystrix还提供了准实时的调用监控(Hystrix Dashboard),Hystrix会持续地记录所有通过Hystrix发起的请求的执行信息,并以统计报表和图形的形式展示给用户,包括每秒执行多少请求多少成功,多少失败等。Netflix通过hystrix-metrics-event-stream项目实现了对以上指标的监控。Spring Cloud也提供了Hystrix Dashboard的整合,对监控内容转化成可视化界面。
2、新建工程consumer-hystrix-dashboard
(1)pom.xml
  <!-- hystrix和 hystrix-dashboard相关-->
   <dependency>
       <groupId>org.springframework.cloud</groupId>
       <artifactId>spring-cloud-starter-hystrix</artifactId>
   </dependency>
   <dependency>
       <groupId>org.springframework.cloud</groupId>
       <artifactId>spring-cloud-starter-hystrix-dashboard</artifactId>
   </dependency>
全部pom
<?xml version="1.0" encoding="UTF-8"?>

<project xmlns="http://maven.apache.org/POM/4.0.0" xmlns:xsi="http://www.w3.org/2001/XMLSchema-instance"
         xsi:schemaLocation="http://maven.apache.org/POM/4.0.0 http://maven.apache.org/xsd/maven-4.0.0.xsd">
    <parent>
        <artifactId>springcloud-demo</artifactId>
        <groupId>com.lin</groupId>
        <version>1.0-SNAPSHOT</version>
    </parent>
    <modelVersion>4.0.0</modelVersion>

    <artifactId>springcloud-consumer-hystrix-dashboard</artifactId>

    <name>springcloud-consumer-hystrix-dashboard</name>
    <!-- FIXME change it to the project's website -->
    <url>http://www.example.com</url>

    <properties>
        <project.build.sourceEncoding>UTF-8</project.build.sourceEncoding>
        <maven.compiler.source>1.7</maven.compiler.source>
        <maven.compiler.target>1.7</maven.compiler.target>
    </properties>

    <dependencies>
        <dependency>
            <groupId>junit</groupId>
            <artifactId>junit</artifactId>
            <version>4.11</version>
            <scope>test</scope>
        </dependency>
        <!--自己定义的api-->
        <dependency>
            <groupId>com.lin</groupId>
            <artifactId>springcloud-api</artifactId>
            <version>${project.version}</version>
        </dependency>
        <dependency>
            <groupId>org.springframework.boot</groupId>
            <artifactId>spring-boot-starter-web</artifactId>
        </dependency>
        <!-- 修改后立即生效,热部署 -->
        <dependency>
            <groupId>org.springframework</groupId>
            <artifactId>springloaded</artifactId>
        </dependency>
        <dependency>
            <groupId>org.springframework.boot</groupId>
            <artifactId>spring-boot-devtools</artifactId>
        </dependency>
        <!-- Ribbon相关 -->
        <dependency>
            <groupId>org.springframework.cloud</groupId>
            <artifactId>spring-cloud-starter-eureka</artifactId>
        </dependency>
        <dependency>
            <groupId>org.springframework.cloud</groupId>
            <artifactId>spring-cloud-starter-ribbon</artifactId>
        </dependency>
        <dependency>
            <groupId>org.springframework.cloud</groupId>
            <artifactId>spring-cloud-starter-config</artifactId>
        </dependency>
        <!-- feign相关 -->
        <dependency>
            <groupId>org.springframework.cloud</groupId>
            <artifactId>spring-cloud-starter-feign</artifactId>
        </dependency>
        <!-- hystrix和 hystrix-dashboard相关 -->
        <dependency>
            <groupId>org.springframework.cloud</groupId>
            <artifactId>spring-cloud-starter-hystrix</artifactId>
        </dependency>
        <dependency>
            <groupId>org.springframework.cloud</groupId>
            <artifactId>spring-cloud-starter-hystrix-dashboard</artifactId>
        </dependency>
    </dependencies>

</project>
(2)application.yml
server:
  port: 9001
(3)主启动类加新注解@EnableHystrixDashboard

(4)所有provider微服务提供者(8001/8002/8003)都需要监控依赖配置
  <!-- actuator监控信息完善 -->
   <dependency>
     <groupId>org.springframework.boot</groupId>
     <artifactId>spring-boot-starter-actuator</artifactId>
   </dependency>
(5)启动consumer-hystrix-dashboard该微服务监控消费端

Delay:该参数用来控制服务器上轮询监控信息的延迟时间,默认为2000毫秒,可以通过配置该属性来降低客户端的网络和CPU消耗。
Title:该参数对应了头部标题Hystrix Stream之后的内容,默认会使用具体监控实例的URL,可以通过配置该信息来展示更合适的标题。
(6)启动provider-hystrix-8001
要访问/hystrix.stream接口,得先访问consumer工程中的任意一个其他接口,否则如果直接访问/hystrix.stream接口的话,会打印出一连串的ping: ping: …。
http://localhost:8001/hystrix.stream
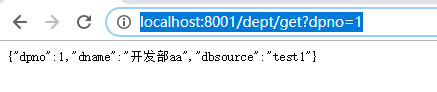
 先访问consumer中的任意一个其他接口,然后在访问/hystrix.stream接口,访问地址如下:http://localhost:8001/hystrix.stream,访问结果如下:
 http://localhost:8001/hystrix.stream

(7)启动相关微服务工程
3个eureka
provider-hystrix-8001
consumer-hystrix-dashboard
(8)监控测试
填写监控地址:
上述我们看到返回结果是一段json数据,单纯的查看json数据,我们很难分析出结果,所以,我们要在Hystrix仪表盘中来查看这一段json,在hystrix仪表盘中输入监控地址,如下:

监控结果:
然后点击Monitor Stream按钮,就可以看到监控画面了,如下:

(9)参数详解

实心圆:共有两种含义。它通过颜色的变化代表了实例的健康程度,它的健康度从绿色<黄色<橙色<红色递减。该实心圆除了颜色的变化之外,它的大小也会根据实例的请求流量发生变化,流量越大该实心圆就越大。所以通过该实心圆的展示,就可以在大量的实例中快速的发现故障实例和高压力实例。
曲线:用来记录2分钟内流量的相对变化,可以通过它来观察到流量的上升和下降趋势。