简单介绍:
EFK 组合插件是k8s项目的一个日志解决方案,它包括三个组件:Elasticsearch, Fluentd, Kibana。相对于ELK这样的架构,k8s官方推行了EFK,可能Fluentd相对于Logstash更加轻量级吧。
Elasticsearch 是日志存储和日志搜索引擎,Fluentd 负责把k8s集群的日志发送给 Elasticsearch, Kibana 则是可视化界面查看和检索存储在 Elasticsearch 的数据。
GitHub官网:https://github.com/kubernetes/kubernetes/tree/master/cluster/addons/fluentd-elasticsearch
测试环境:
| System | Hostname | IP |
| CentOS 7.6 | k8s-master | 138.138.82.14 |
| CentOS 7.6 | k8s-node1 | 138.138.82.15 |
| CentOS 7.6 | k8s-node2 | 138.138.82.16 |

注:以下是简单的安装部署操作,实际用于生产环境的话还要根据不同的后端存储进而修改yaml中的相应存储路径。
操作步骤:
1. 获取yaml文件
从github官网下载:https://github.com/kubernetes/kubernetes/tree/master/cluster/addons/fluentd-elasticsearch
解压后yanl文件位置: kubernetes/cluster/addons/fluentd-elasticsearch/
复制yaml文件到另一处进行修改操作:
[root@k8s-master ~]# mkdir efk
[root@k8s-master ~]# cp kubernetes/cluster/addons/fluentd-elasticsearch/*.yaml  efk/
[root@k8s-master ~]# cd efk/
[root@k8s-master efk]# ll
总用量 36
-rw-r--r-- 1 root root   382 5月   5 13:55 es-service.yaml
-rw-r--r-- 1 root root  2906 5月   5 14:44 es-statefulset.yaml
-rw-r--r-- 1 root root 16124 5月   5 13:55 fluentd-es-configmap.yaml
-rw-r--r-- 1 root root  2702 5月   5 13:55 fluentd-es-ds.yaml
-rw-r--r-- 1 root root  1052 5月   5 13:55 kibana-deployment.yaml
-rw-r--r-- 1 root root   354 5月   5 13:55 kibana-service.yaml
2. 准备镜像(在所有主机上)
注:因为被墙的缘故,加上镜像文件比较大,启动会费时,可以提前单独下载好所需镜像。
①修改 es-statefulset.yaml (https://www.docker.elastic.co/#)

②修改 fluentd-es-ds.yaml

③无需修改 kibana-deployment.yaml

说明:关于kibana镜像以-oss结尾的版本好奇(default release that contains the commercially licensed code. The release that contains only open source will have the -oss appended to it.):
https://www.elastic.co/guide/en/kibana/6.0/docker.html
附上镜像拉取文本:


~]# docker pull docker.elastic.co/elasticsearch/elasticsearch:6.6.2
~]# docker pull registry.cn-hangzhou.aliyuncs.com/google_containers/fluentd-elasticsearch:v2.4.0
~]# docker pull docker.elastic.co/kibana/kibana-oss:6.6.1
3. 发布yaml文件到k8s中
[root@k8s-master efk]# kubectl apply -f .
4. 查看各pod状态
[root@k8s-master efk]# kubectl get po -n kube-system -o wide
NAME                                    READY   STATUS    RESTARTS   AGE     IP              NODE         NOMINATED NODE   READINESS GATES
calico-node-b78m4                       1/1     Running   0          7d1h    138.138.82.16   k8s-node2    <none>           <none>
calico-node-r5mlj                       1/1     Running   0          7d1h    138.138.82.14   k8s-master   <none>           <none>
calico-node-z5tdh                       1/1     Running   0          7d1h    138.138.82.15   k8s-node1    <none>           <none>
coredns-fb8b8dccf-6mgks                 1/1     Running   0          7d1h    192.168.0.7     k8s-master   <none>           <none>
coredns-fb8b8dccf-cbtlx                 1/1     Running   0          7d1h    192.168.0.6     k8s-master   <none>           <none>
elasticsearch-logging-0                 1/1     Running   0          10m     192.168.2.11    k8s-node2    <none>           <none>
elasticsearch-logging-1                 1/1     Running   0          10m     192.168.1.17    k8s-node1    <none>           <none>
etcd-k8s-master                         1/1     Running   0          7d1h    138.138.82.14   k8s-master   <none>           <none>
fluentd-es-v2.4.0-fm9n2                 1/1     Running   0          10m     192.168.1.16    k8s-node1    <none>           <none>
fluentd-es-v2.4.0-xjx6h                 1/1     Running   0          10m     192.168.2.10    k8s-node2    <none>           <none>
kibana-logging-f4d99b69f-hc4h9          1/1     Running   0          10m     192.168.1.15    k8s-node1    <none>           <none>
kube-apiserver-k8s-master               1/1     Running   0          7d1h    138.138.82.14   k8s-master   <none>           <none>
kube-controller-manager-k8s-master      1/1     Running   1          7d1h    138.138.82.14   k8s-master   <none>           <none>
kube-proxy-c9xd2                        1/1     Running   0          7d1h    138.138.82.14   k8s-master   <none>           <none>
kube-proxy-fp2r2                        1/1     Running   0          7d1h    138.138.82.15   k8s-node1    <none>           <none>
kube-proxy-lrsw7                        1/1     Running   0          7d1h    138.138.82.16   k8s-node2    <none>           <none>
kube-scheduler-k8s-master               1/1     Running   1          7d1h    138.138.82.14   k8s-master   <none>           <none>
kubernetes-dashboard-5f7b999d65-45vlk   1/1     Running   0          6d7h    192.168.1.14    k8s-node1    <none>           <none>
metrics-server-7579f696d8-pgcc4         1/1     Running   0          6d22h   192.168.1.12    k8s-node1    <none>           <none>
顺利的话,稍等一小会就成功running状态了。如果有问题,就查看容器日志,基本上可以定位到所有错误原因。
5. 查看kibana
留意kibana的日志输出,这里给出我的实际一段:
[root@k8s-master efk]# kubectl logs -n kube-system kibana-logging-f4d99b69f-hc4h9 -f
{"type":"log","@timestamp":"2019-05-05T08:02:58Z","tags":["warning","config","deprecation"],"pid":1,"message":"You should set server.basePath along with server.rewriteBasePath. Starting in 7.0, Kibana will expect that all requests start with server.basePath rather than expecting you to rewrite the requests in your reverse proxy. Set server.rewriteBasePath to false to preserve the current behavior and silence this warning."}
{"type":"log","@timestamp":"2019-05-05T08:02:58Z","tags":["plugin","warning"],"pid":1,"path":"/usr/share/kibana/src/legacy/core_plugins/ems_util","message":"Skipping non-plugin directory at /usr/share/kibana/src/legacy/core_plugins/ems_util"}
{"type":"log","@timestamp":"2019-05-05T08:02:59Z","tags":["warning","elasticsearch","config","deprecation"],"pid":1,"message":"Config key \"url\" is deprecated. It has been replaced with \"hosts\""}
{"type":"log","@timestamp":"2019-05-05T08:03:00Z","tags":["status","plugin:[email protected]","info"],"pid":1,"state":"green","message":"Status changed from uninitialized to green - Ready","prevState":"uninitialized","prevMsg":"uninitialized"}
{"type":"log","@timestamp":"2019-05-05T08:03:00Z","tags":["status","plugin:[email protected]","info"],"pid":1,"state":"yellow","message":"Status changed from uninitialized to yellow - Waiting for Elasticsearch","prevState":"uninitialized","prevMsg":"uninitialized"}
{"type":"log","@timestamp":"2019-05-05T08:03:00Z","tags":["status","plugin:[email protected]","info"],"pid":1,"state":"green","message":"Status changed from uninitialized to green - Ready","prevState":"uninitialized","prevMsg":"uninitialized"}
{"type":"log","@timestamp":"2019-05-05T08:03:00Z","tags":["error","elasticsearch","admin"],"pid":1,"message":"Request error, retrying\nHEAD http://elasticsearch-logging:9200/ => connect ECONNREFUSED 10.100.54.183:9200"}
{"type":"log","@timestamp":"2019-05-05T08:03:00Z","tags":["warning","elasticsearch","admin"],"pid":1,"message":"Unable to revive connection: http://elasticsearch-logging:9200/"}
{"type":"log","@timestamp":"2019-05-05T08:03:00Z","tags":["warning","elasticsearch","admin"],"pid":1,"message":"No living connections"}
{"type":"log","@timestamp":"2019-05-05T08:03:00Z","tags":["status","plugin:[email protected]","error"],"pid":1,"state":"red","message":"Status changed from yellow to red - Unable to connect to Elasticsearch.","prevState":"yellow","prevMsg":"Waiting for Elasticsearch"}
{"type":"log","@timestamp":"2019-05-05T08:03:01Z","tags":["status","plugin:[email protected]","info"],"pid":1,"state":"green","message":"Status changed from uninitialized to green - Ready","prevState":"uninitialized","prevMsg":"uninitialized"}
{"type":"log","@timestamp":"2019-05-05T08:03:01Z","tags":["status","plugin:[email protected]","info"],"pid":1,"state":"green","message":"Status changed from uninitialized to green - Ready","prevState":"uninitialized","prevMsg":"uninitialized"}
{"type":"log","@timestamp":"2019-05-05T08:03:01Z","tags":["status","plugin:[email protected]","info"],"pid":1,"state":"green","message":"Status changed from uninitialized to green - Ready","prevState":"uninitialized","prevMsg":"uninitialized"}
{"type":"log","@timestamp":"2019-05-05T08:03:03Z","tags":["warning","elasticsearch","admin"],"pid":1,"message":"Unable to revive connection: http://elasticsearch-logging:9200/"}
{"type":"log","@timestamp":"2019-05-05T08:03:03Z","tags":["warning","elasticsearch","admin"],"pid":1,"message":"No living connections"}
{"type":"log","@timestamp":"2019-05-05T08:03:06Z","tags":["warning","elasticsearch","admin"],"pid":1,"message":"Unable to revive connection: http://elasticsearch-logging:9200/"}
{"type":"log","@timestamp":"2019-05-05T08:03:06Z","tags":["warning","elasticsearch","admin"],"pid":1,"message":"No living connections"}
{"type":"log","@timestamp":"2019-05-05T08:03:08Z","tags":["warning","elasticsearch","admin"],"pid":1,"message":"Unable to revive connection: http://elasticsearch-logging:9200/"}
{"type":"log","@timestamp":"2019-05-05T08:03:08Z","tags":["warning","elasticsearch","admin"],"pid":1,"message":"No living connections"}
{"type":"log","@timestamp":"2019-05-05T08:03:11Z","tags":["warning","elasticsearch","admin"],"pid":1,"message":"Unable to revive connection: http://elasticsearch-logging:9200/"}
{"type":"log","@timestamp":"2019-05-05T08:03:11Z","tags":["warning","elasticsearch","admin"],"pid":1,"message":"No living connections"}
{"type":"log","@timestamp":"2019-05-05T08:03:13Z","tags":["warning","elasticsearch","admin"],"pid":1,"message":"Unable to revive connection: http://elasticsearch-logging:9200/"}
{"type":"log","@timestamp":"2019-05-05T08:03:13Z","tags":["warning","elasticsearch","admin"],"pid":1,"message":"No living connections"}
{"type":"log","@timestamp":"2019-05-05T08:03:16Z","tags":["warning","elasticsearch","admin"],"pid":1,"message":"Unable to revive connection: http://elasticsearch-logging:9200/"}
{"type":"log","@timestamp":"2019-05-05T08:03:16Z","tags":["warning","elasticsearch","admin"],"pid":1,"message":"No living connections"}
{"type":"log","@timestamp":"2019-05-05T08:03:18Z","tags":["warning","elasticsearch","admin"],"pid":1,"message":"Unable to revive connection: http://elasticsearch-logging:9200/"}
{"type":"log","@timestamp":"2019-05-05T08:03:18Z","tags":["warning","elasticsearch","admin"],"pid":1,"message":"No living connections"}
{"type":"log","@timestamp":"2019-05-05T08:03:21Z","tags":["warning","elasticsearch","admin"],"pid":1,"message":"Unable to revive connection: http://elasticsearch-logging:9200/"}
{"type":"log","@timestamp":"2019-05-05T08:03:21Z","tags":["warning","elasticsearch","admin"],"pid":1,"message":"No living connections"}
{"type":"log","@timestamp":"2019-05-05T08:03:23Z","tags":["warning","elasticsearch","admin"],"pid":1,"message":"Unable to revive connection: http://elasticsearch-logging:9200/"}
{"type":"log","@timestamp":"2019-05-05T08:03:23Z","tags":["warning","elasticsearch","admin"],"pid":1,"message":"No living connections"}
{"type":"log","@timestamp":"2019-05-05T08:03:26Z","tags":["warning","elasticsearch","admin"],"pid":1,"message":"Unable to revive connection: http://elasticsearch-logging:9200/"}
{"type":"log","@timestamp":"2019-05-05T08:03:26Z","tags":["warning","elasticsearch","admin"],"pid":1,"message":"No living connections"}
{"type":"log","@timestamp":"2019-05-05T08:03:28Z","tags":["warning","elasticsearch","admin"],"pid":1,"message":"Unable to revive connection: http://elasticsearch-logging:9200/"}
{"type":"log","@timestamp":"2019-05-05T08:03:28Z","tags":["warning","elasticsearch","admin"],"pid":1,"message":"No living connections"}
{"type":"log","@timestamp":"2019-05-05T08:03:31Z","tags":["warning","elasticsearch","admin"],"pid":1,"message":"Unable to revive connection: http://elasticsearch-logging:9200/"}
{"type":"log","@timestamp":"2019-05-05T08:03:31Z","tags":["warning","elasticsearch","admin"],"pid":1,"message":"No living connections"}
{"type":"log","@timestamp":"2019-05-05T08:03:33Z","tags":["warning","elasticsearch","admin"],"pid":1,"message":"Unable to revive connection: http://elasticsearch-logging:9200/"}
{"type":"log","@timestamp":"2019-05-05T08:03:33Z","tags":["warning","elasticsearch","admin"],"pid":1,"message":"No living connections"}
{"type":"log","@timestamp":"2019-05-05T08:03:36Z","tags":["warning","elasticsearch","admin"],"pid":1,"message":"Unable to revive connection: http://elasticsearch-logging:9200/"}
{"type":"log","@timestamp":"2019-05-05T08:03:36Z","tags":["warning","elasticsearch","admin"],"pid":1,"message":"No living connections"}
{"type":"log","@timestamp":"2019-05-05T08:03:38Z","tags":["warning","elasticsearch","admin"],"pid":1,"message":"Unable to revive connection: http://elasticsearch-logging:9200/"}
{"type":"log","@timestamp":"2019-05-05T08:03:38Z","tags":["warning","elasticsearch","admin"],"pid":1,"message":"No living connections"}
{"type":"log","@timestamp":"2019-05-05T08:03:41Z","tags":["warning","elasticsearch","admin"],"pid":1,"message":"Unable to revive connection: http://elasticsearch-logging:9200/"}
{"type":"log","@timestamp":"2019-05-05T08:03:41Z","tags":["warning","elasticsearch","admin"],"pid":1,"message":"No living connections"}
{"type":"log","@timestamp":"2019-05-05T08:03:44Z","tags":["warning","elasticsearch","admin"],"pid":1,"message":"Unable to revive connection: http://elasticsearch-logging:9200/"}
{"type":"log","@timestamp":"2019-05-05T08:03:44Z","tags":["warning","elasticsearch","admin"],"pid":1,"message":"No living connections"}
{"type":"log","@timestamp":"2019-05-05T08:03:46Z","tags":["warning","elasticsearch","admin"],"pid":1,"message":"Unable to revive connection: http://elasticsearch-logging:9200/"}
{"type":"log","@timestamp":"2019-05-05T08:03:46Z","tags":["warning","elasticsearch","admin"],"pid":1,"message":"No living connections"}
{"type":"log","@timestamp":"2019-05-05T08:03:49Z","tags":["warning","elasticsearch","admin"],"pid":1,"message":"Unable to revive connection: http://elasticsearch-logging:9200/"}
{"type":"log","@timestamp":"2019-05-05T08:03:49Z","tags":["warning","elasticsearch","admin"],"pid":1,"message":"No living connections"}
{"type":"log","@timestamp":"2019-05-05T08:03:51Z","tags":["warning","elasticsearch","admin"],"pid":1,"message":"Unable to revive connection: http://elasticsearch-logging:9200/"}
{"type":"log","@timestamp":"2019-05-05T08:03:51Z","tags":["warning","elasticsearch","admin"],"pid":1,"message":"No living connections"}
{"type":"log","@timestamp":"2019-05-05T08:03:54Z","tags":["warning","elasticsearch","admin"],"pid":1,"message":"Unable to revive connection: http://elasticsearch-logging:9200/"}
{"type":"log","@timestamp":"2019-05-05T08:03:54Z","tags":["warning","elasticsearch","admin"],"pid":1,"message":"No living connections"}
{"type":"log","@timestamp":"2019-05-05T08:03:56Z","tags":["warning","elasticsearch","admin"],"pid":1,"message":"Unable to revive connection: http://elasticsearch-logging:9200/"}
{"type":"log","@timestamp":"2019-05-05T08:03:56Z","tags":["warning","elasticsearch","admin"],"pid":1,"message":"No living connections"}
{"type":"log","@timestamp":"2019-05-05T08:03:59Z","tags":["error","elasticsearch","admin"],"pid":1,"message":"Request error, retrying\nHEAD http://elasticsearch-logging:9200/ => connect ECONNREFUSED 10.100.54.183:9200"}
{"type":"log","@timestamp":"2019-05-05T08:03:59Z","tags":["warning"],"pid":1,"kibanaVersion":"6.6.1","nodes":[{"version":"6.6.2","http":{"publish_address":"192.168.2.11:9200"},"ip":"192.168.2.11"}],"message":"You're running Kibana 6.6.1 with some different versions of Elasticsearch. Update Kibana or Elasticsearch to the same version to prevent compatibility issues: v6.6.2 @ 192.168.2.11:9200 (192.168.2.11)"}
{"type":"log","@timestamp":"2019-05-05T08:03:59Z","tags":["status","plugin:[email protected]","info"],"pid":1,"state":"green","message":"Status changed from red to green - Ready","prevState":"red","prevMsg":"Unable to connect to Elasticsearch."}
{"type":"log","@timestamp":"2019-05-05T08:03:59Z","tags":["info","migrations"],"pid":1,"message":"Creating index .kibana_1."}
{"type":"log","@timestamp":"2019-05-05T08:04:00Z","tags":["info","migrations"],"pid":1,"message":"Pointing alias .kibana to .kibana_1."}
{"type":"log","@timestamp":"2019-05-05T08:04:00Z","tags":["info","migrations"],"pid":1,"message":"Finished in 994ms."}
{"type":"log","@timestamp":"2019-05-05T08:04:00Z","tags":["listening","info"],"pid":1,"message":"Server running at http://0:5601"}
以上显示了启动成功的一段过程。
查看kibana地址
[root@k8s-master ~]# kubectl cluster-info |grep kibana
Kibana is running at https://138.138.82.14:6443/api/v1/namespaces/kube-system/services/kibana-logging/proxy
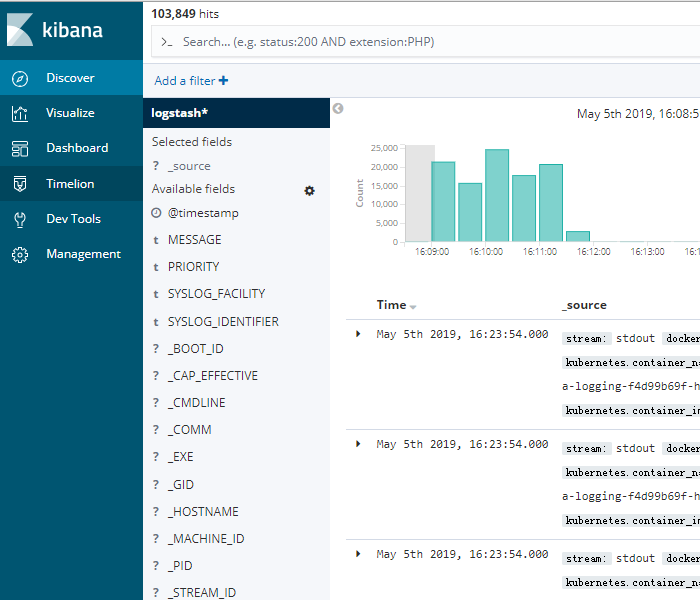
在浏览器中输入以上链接即可,效果如下:
EFK插件简单部署到此结束,实际生产应用还需修改yaml文件相关参数。
结束.