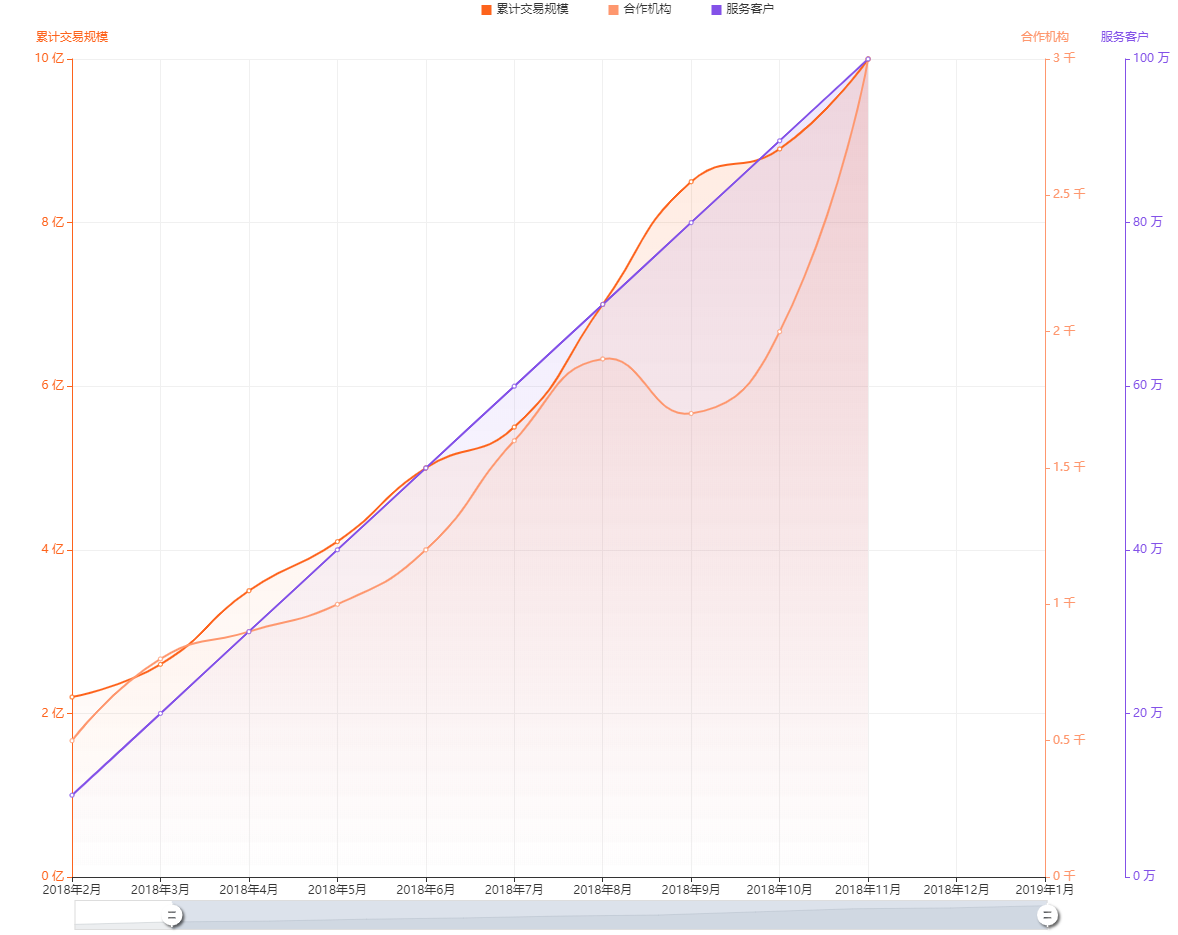
最终结果
先引入百度echarts
<!DOCTYPE html>
<html style="height: 100%">
   <head>
       <meta charset="utf-8">
   </head>
   <body style="height: 100%; margin: 0">
       <div id="container" style="height: 100%"></div>
       <script type="text/javascript" src="http://echarts.baidu.com/gallery/vendors/echarts/echarts.min.js"></script>
       <script type="text/javascript">
            var dom = document.getElementById("container");
            var myChart = echarts.init(dom);
            option = null;

            var colors = ['#ff6400', '#ff976a', '#8250eb'];
            var datas = [
                [1,2.2,2.6,3.5,4.1,5,5.5,7,8.5,8.9,10],
                [0,0.5,0.8,0.9,1,1.2,1.6,1.9,1.7,2,3],
                [0,10,20,30,40,50,60,70,80,90,100]
            ];
            var date = ['2018年1月','2018年2月','2018年3月','2018年4月','2018年5月','2018年6月','2018年7月','2018年8月','2018年9月','2018年10月','2018年11月','2018年12月','2019年1月'];

            option = {
                color: colors,
                tooltip: {
                    trigger: 'axis',
                    position: function (pt) {
                        return [pt[0], '10%'];
                    }
                },
                grid: {
                    right: '20%'
                },
                legend: {
                    data:['累计交易规模','合作机构','服务客户'],
                    icon: "rect",   //  这个字段控制形状  类型包括 circle,rect ,roundRect,triangle,diamond,pin,arrow,none
                    itemWidth: 10,  // 设置宽度
                    itemHeight: 10, // 设置高度
                    itemGap: 40 // 设置间距
                },
                dataZoom: [{
                    type: 'inside',
                    start: 10,
                    end: 100
                }, {
                    start: 0,
                    end: 100,
                    handleIcon: 'M10.7,11.9v-1.3H9.3v1.3c-4.9,0.3-8.8,4.4-8.8,9.4c0,5,3.9,9.1,8.8,9.4v1.3h1.3v-1.3c4.9-0.3,8.8-4.4,8.8-9.4C19.5,16.3,15.6,12.2,10.7,11.9z M13.3,24.4H6.7V23h6.6V24.4z M13.3,19.6H6.7v-1.4h6.6V19.6z',
                    handleSize: '80%',
                    handleStyle: {
                        color: '#fff',
                        shadowBlur: 3,
                        shadowColor: 'rgba(0, 0, 0, 0.6)',
                        shadowOffsetX: 2,
                        shadowOffsetY: 2
                    }
                }],
                xAxis: [
                    {
                        type: 'category',
                        splitLine: {
                            show: true,
                            lineStyle:{
                               color: '#f0f0f0',
                               width: 1,
                               type: 'solid'
                          }
                      },
                        boundaryGap: false,
                        data: date
                    }
                ],
                yAxis: [
                    {
                        type: 'value',
                        name: '累计交易规模',
                        position: 'left',
                        axisLine: {
                            lineStyle: {
                                color: colors[0]
                            }
                        },
                        splitLine: {
                            show: true,
                            lineStyle:{
                               color: '#f0f0f0',
                               width: 1,
                               type: 'solid'
                          }
                      },
                        axisLabel: {
                            formatter: '{value} 亿'
                        }
                    },
                    {
                        type: 'value',
                        name: '合作机构',
                        position: 'right',
                        axisLine: {
                            lineStyle: {
                                color: colors[1]
                            }
                        },
                        splitLine:{
                        show:false
                      },
                        axisLabel: {
                            formatter: '{value} 千'
                        }
                    },
                    {
                        type: 'value',
                        name: '服务客户',
                        offset: 80,
                        position: 'right',
                        axisLine: {
                            lineStyle: {
                                color: colors[2]
                            }
                        },
                        splitLine:{
                        show:false
                      },
                        axisLabel: {
                            formatter: '{value} 万'
                        }
                    }
                ],
                series: [
                    {
                        name:'累计交易规模',
                        type:'line',
                        smooth:true, //数据光滑过度
                        itemStyle: {
                            color: '#ff6400'
                        },
                        areaStyle: {
                            normal: {
                                color: new echarts.graphic.LinearGradient(0, 0, 0, 1, [{
                                    offset: 0,
                                    color: 'rgba(255,100,0,0.2)'
                                }, {
                                    offset: 1,
                                    color: 'rgba(255,100,0,0)'
                                }])
                            }
                        },
                        data:datas[0]
                    },
                    {
                        name:'合作机构',
                        type:'line',
                        smooth:true, //数据光滑过度
                        yAxisIndex: 1,
                        itemStyle: {
                            color: '#ff976a'
                        },
                        areaStyle: {
                            normal: {
                                color: new echarts.graphic.LinearGradient(0, 0, 0, 1, [{
                                    offset: 0,
                                    color: 'rgba(255,151,106,0.2)'
                                }, {
                                    offset: 1,
                                    color: 'rgba(255,151,106,0)'
                                }])
                            }
                        },
                        data:datas[1]
                    },
                    {
                        name:'服务客户',
                        type:'line',
                        smooth:true, //数据光滑过度
                        yAxisIndex: 2,
                        itemStyle: {
                            color: '#8250eb'
                        },
                        areaStyle: {
                            normal: {
                                color: new echarts.graphic.LinearGradient(0, 0, 0, 1, [{
                                    offset: 0,
                                    color: 'rgba(130,80,235,0.2)'
                                }, {
                                    offset: 1,
                                    color: 'rgba(130,80,235,0)'
                                }])
                            }
                        },
                        data:datas[2]
                    }
                ]
            };

            if (option && typeof option === "object") {
                myChart.setOption(option, true);
            }
       </script>
   </body>
</html>