标准化方法
Z-score Normalization
Z-score normalization又叫 standardization(规范化),将特征进行缩放使得其具有均值为0,方差为1的标准正态分布的特性。
\[ z = \frac{x-\mu}{\sigma} \]
其中均值\(\mu = \frac{1}{N} \sum_{i=1}^N (x_i)\),方差\(\sigma = \sqrt{\frac{1}{N} \sum_{i=1}^N (x_i - \mu)^2}\)。
标准化特征使其具有0均值1方差不仅对于比较单位不同的测量有用,而且还是众多机器学习算法的普遍要求。如果特征在不同的尺度下,不同的权重更新的速率会差异很大,不利于算法的收敛。
Mix-max Normalization
另一种常用的标准化叫Mix-max normalization,通常被简称为normalization(标准化)。这种方法将数据放缩到一个固定的区间,通常是0到1之间。
\[ z = \frac{x-\min{(x)}}{\max{(x)}-\min{(x)}} \]
Constant Normalization
将数据除以一个固定的常数,比如最大值:
\[ z = \frac{x}{\max{(|x|)}} \]
Binary Encoding
类别值(Categorical values)例如性别可以编码为0和1,如男性为1,女性为0,也可以编码为-1和1.
Manhattan Encoding
如果是不能二进制编码的类别值,可以使用曼哈顿编码Manhattan encoding,使用0或1来表示特征是否被包含:
例如:在宗教类别中,可以将穆斯林(Muslim)、印度教(Hindu)和基督教(Christian)分别编码为 [1 0 0]、[0 1 0] 和 [0 0 1]。
示例代码
代码参考自About Feature Scaling and Normalization
import pandas as pd
import numpy as np
df = pd.io.parsers.read_csv(
'https://raw.githubusercontent.com/rasbt/pattern_classification/master/data/wine_data.csv',
header=None,
usecols=[0,1,2]
)
df.columns=['Class label', 'Alcohol', 'Malic acid']
df.head()
from sklearn import preprocessing
# Compute the mean and std to be used for later scaling.
std_scale = preprocessing.StandardScaler().fit(df[['Alcohol', 'Malic acid']])
# Perform standardization by centering and scaling
df_std = std_scale.transform(df[['Alcohol', 'Malic acid']])
minmax_scale = preprocessing.MinMaxScaler().fit(df[['Alcohol', 'Malic acid']])
df_minmax = minmax_scale.transform(df[['Alcohol', 'Malic acid']])
print('Mean after standardization:\nAlcohol={:.2f}, Malic acid={:.2f}'
.format(df_std[:,0].mean(), df_std[:,1].mean()))
print('\nStandard deviation after standardization:\nAlcohol={:.2f}, Malic acid={:.2f}'
.format(df_std[:,0].std(), df_std[:,1].std()))
print('\nMin-value after min-max scaling:\nAlcohol={:.2f}, Malic acid={:.2f}'
.format(df_minmax[:,0].min(), df_minmax[:,1].min()))
print('Max-value after min-max scaling:\nAlcohol={:.2f}, Malic acid={:.2f}'
.format(df_minmax[:,0].max(), df_minmax[:,1].max()))
from sys import platform as _platform
if _platform == "darwin":
import matplotlib
matplotlib.use('TkAgg')
from matplotlib import pyplot as plt
def plot():
plt.figure(figsize=(8,6))
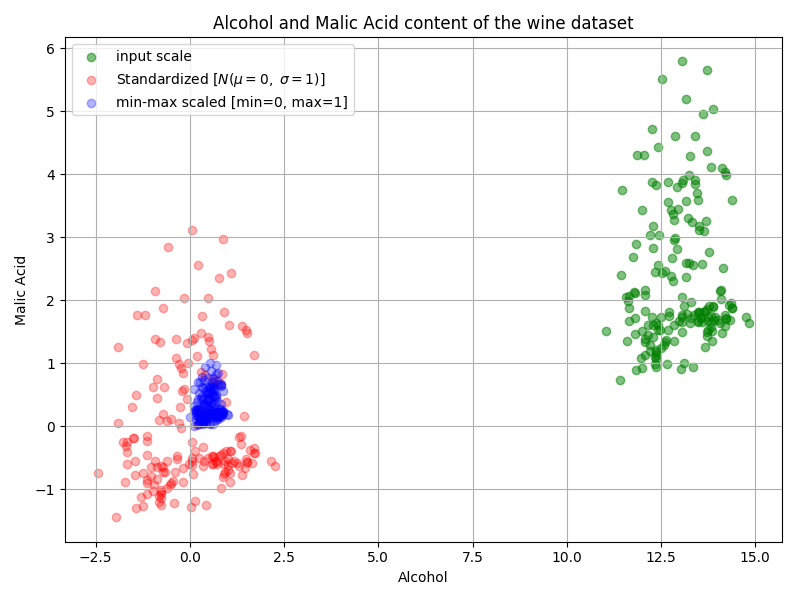
plt.scatter(df['Alcohol'], df['Malic acid'],
color='green', label='input scale', alpha=0.5)
plt.scatter(df_std[:,0], df_std[:,1], color='red',
label='Standardized [$N (\mu=0, \; \sigma=1)$]', alpha=0.3)
plt.scatter(df_minmax[:,0], df_minmax[:,1],
color='blue', label='min-max scaled [min=0, max=1]', alpha=0.3)
plt.title('Alcohol and Malic Acid content of the wine dataset')
plt.xlabel('Alcohol')
plt.ylabel('Malic Acid')
plt.legend(loc='upper left')
plt.grid()
plt.tight_layout()
plot()
plt.show()结果