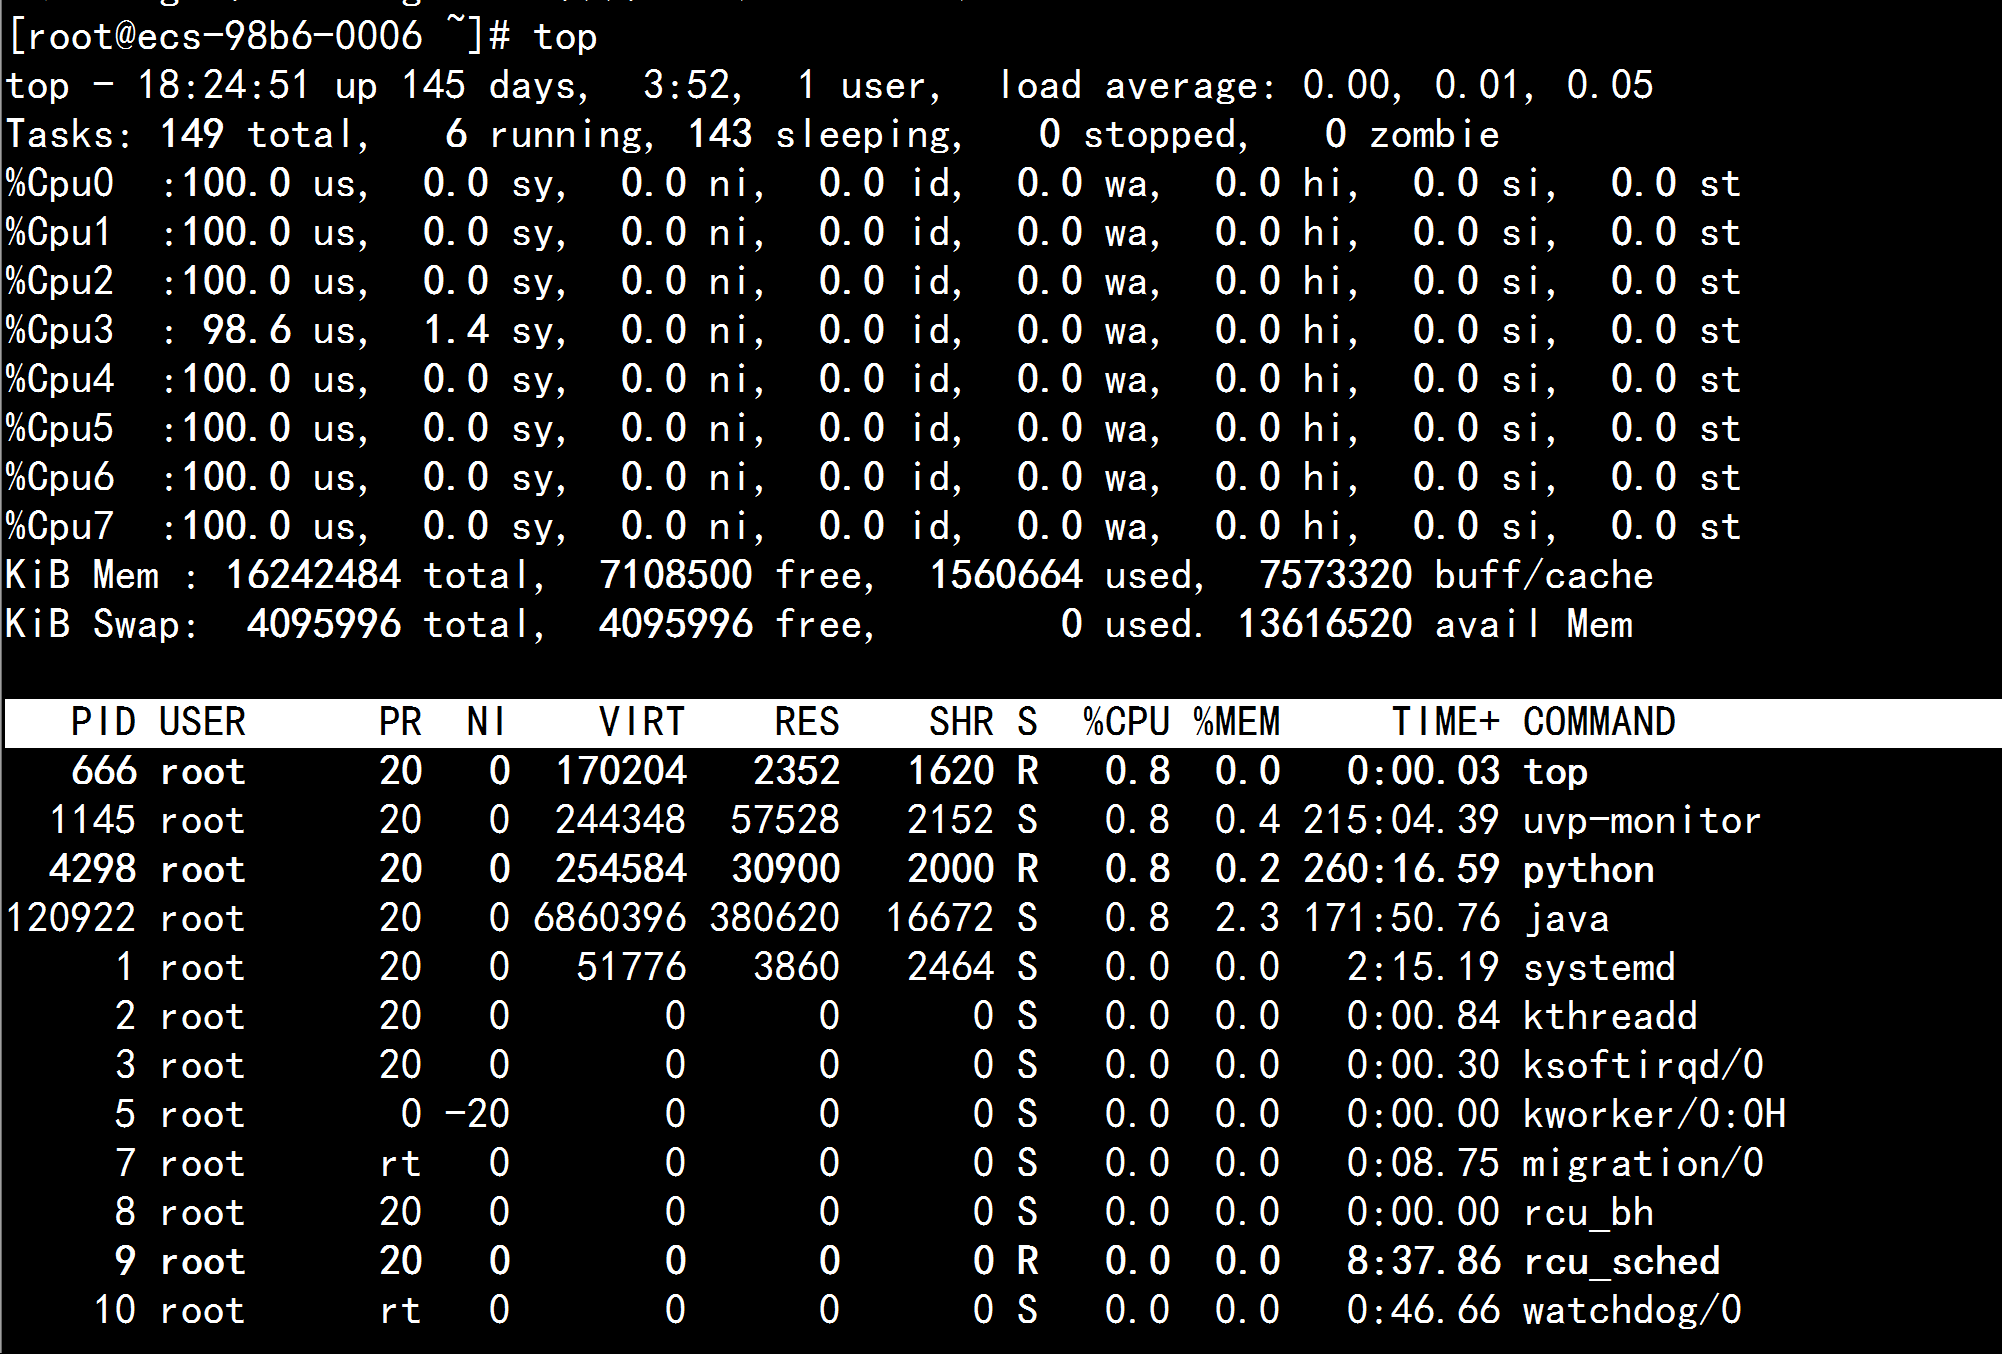
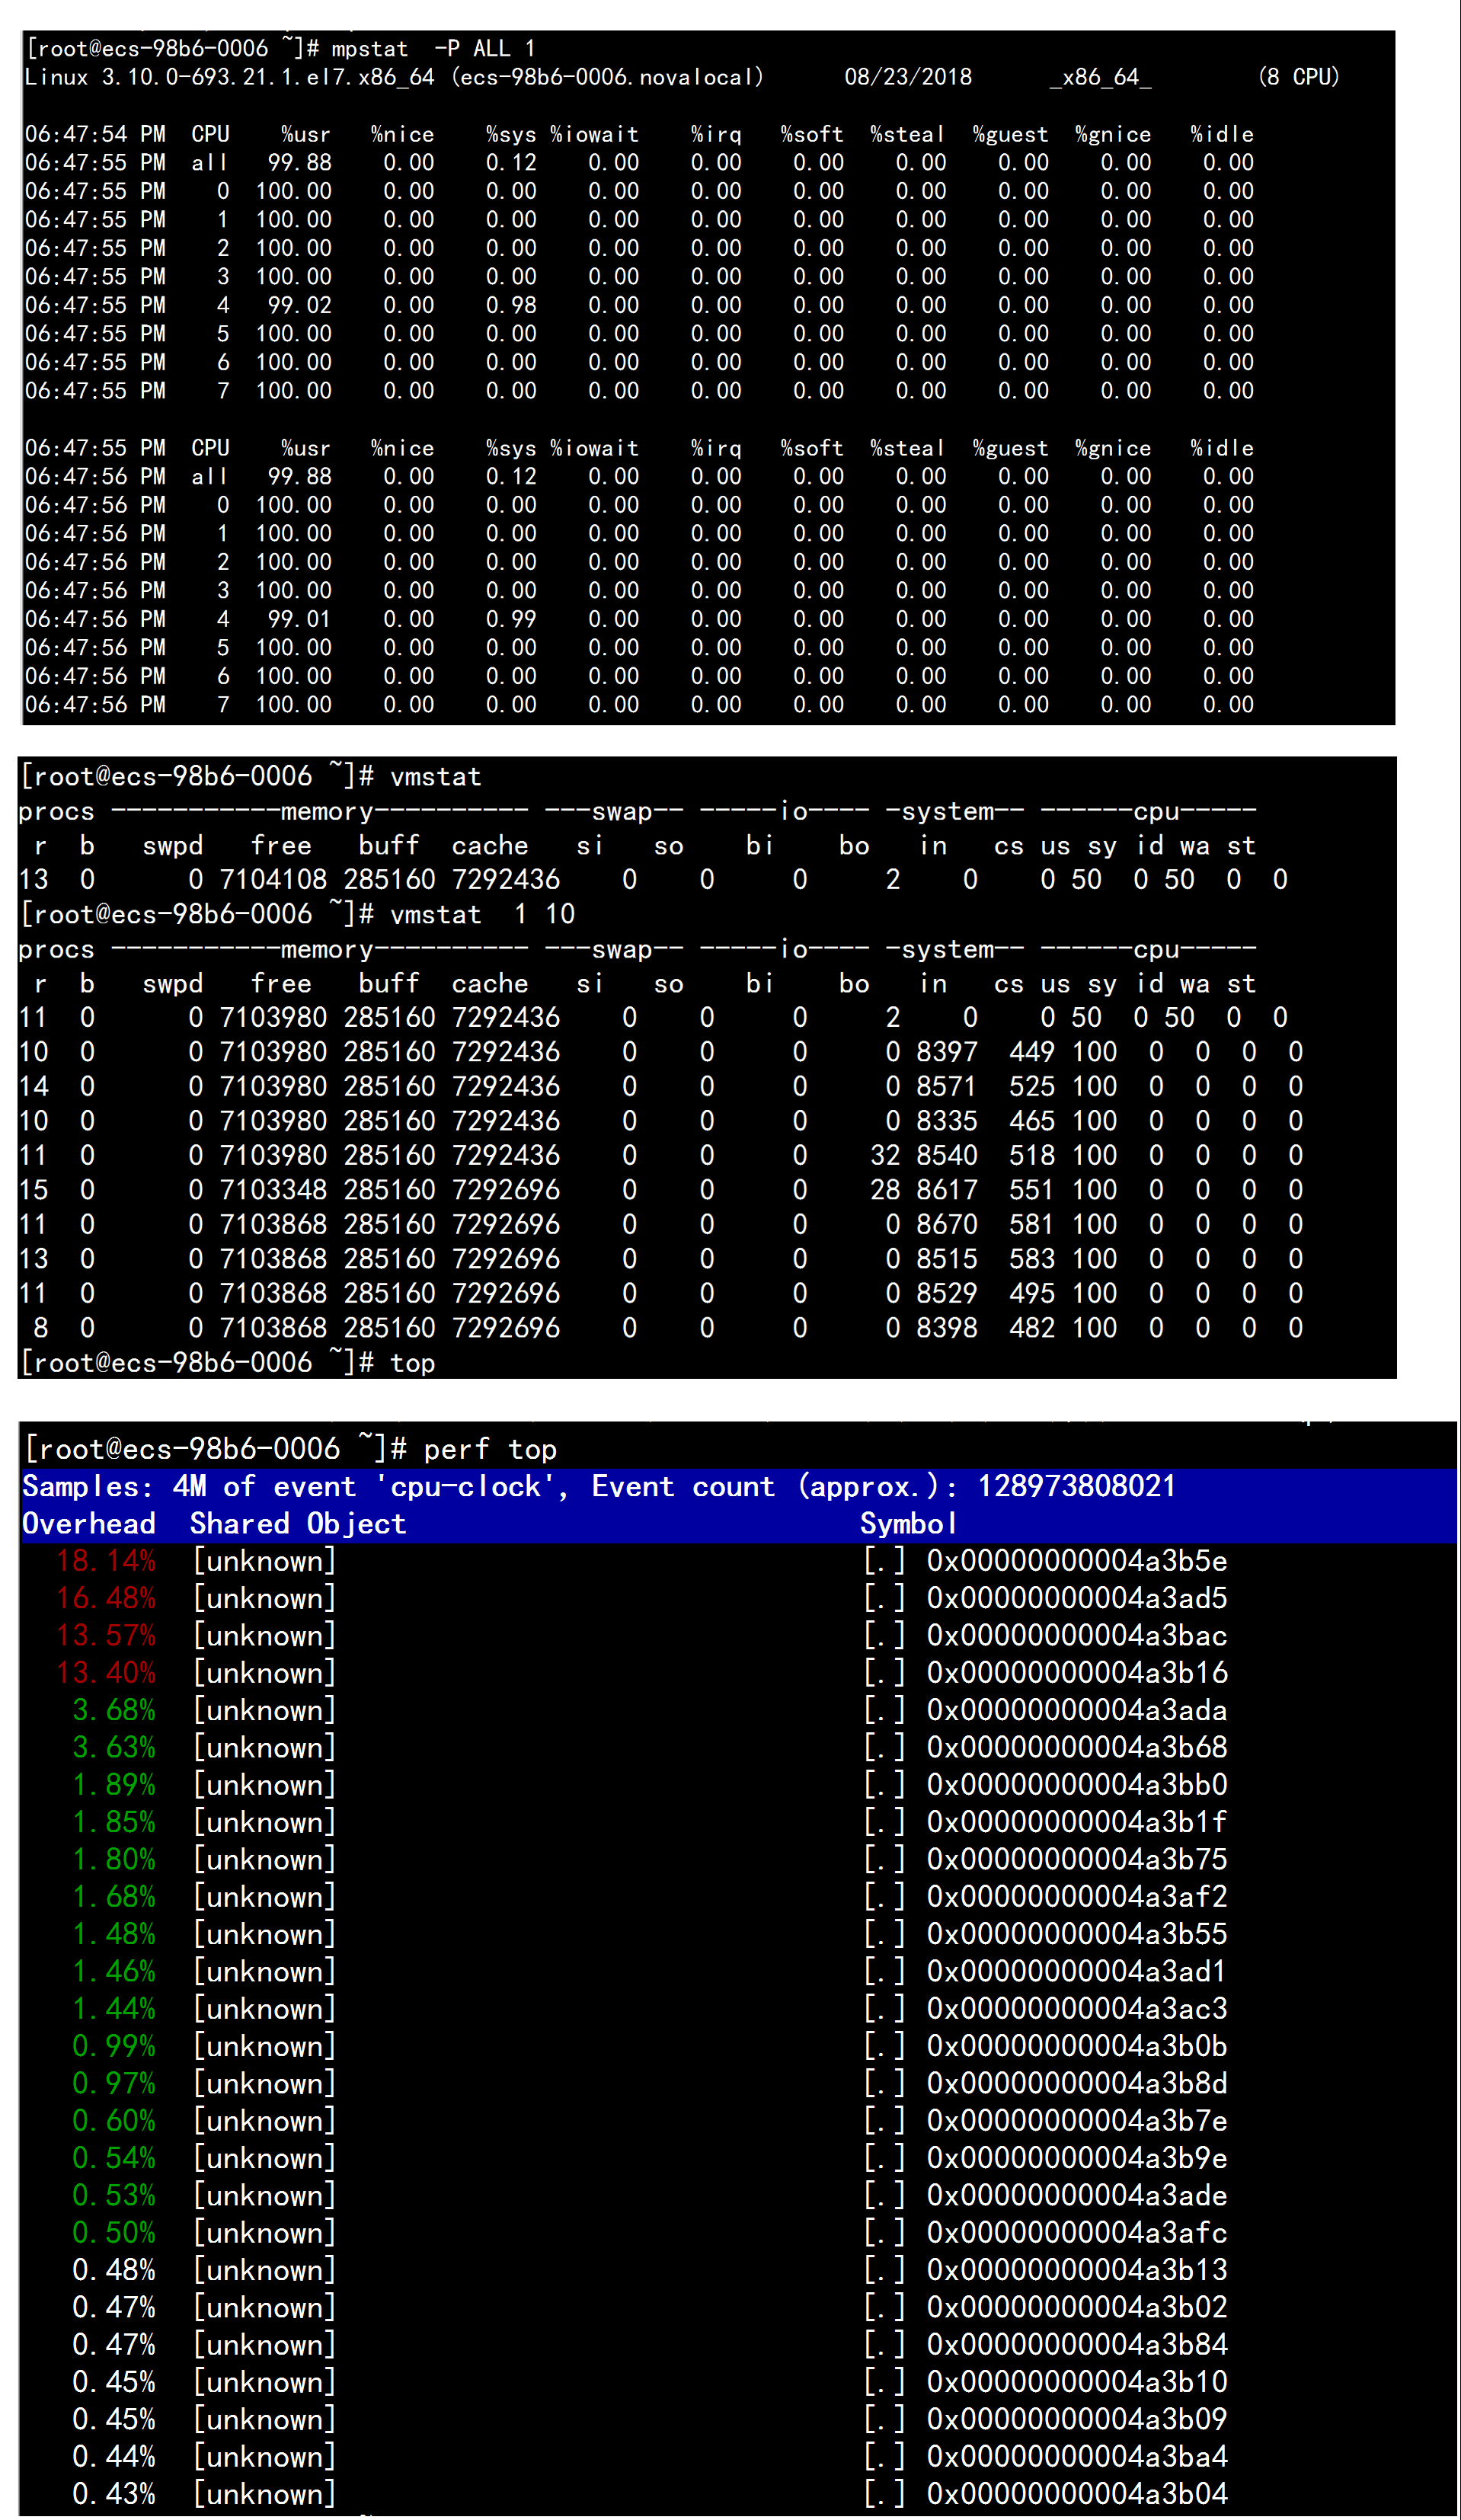
通过 atop \vmstat \sar \perf 等命令查询,主机各项指标除CPU外,均无压力;

使用sched_switch 跟踪器进行定位;
[root@ecs-98b6-0006 ~]# mount | grep debug
debugfs on /sys/kernel/debug type debugfs (rw,relatime)
[root@ecs-98b6-0006 ~]# cd /sys/kernel/debug/tracing/events/sched/ sched_switch/
[root@ecs-98b6-0006 sched_switch]# cat enable 【0表示关闭 1表示开启】
[root@ecs-98b6-0006 sched_switch]# echo 1 > enable
[root@ecs-98b6-0006 sched_switch]# cd ../../
[root@ecs-98b6-0006 events]# cd ../
[root@ecs-98b6-0006 tracing]# cat trace > /home/trace 【进程切换以及唤醒调度日志】
[root@ecs-98b6-0006 tracing]# echo 0 > events/sched/sched_switch/enable
[root@ecs-98b6-0006 tracing]# cd /home/

如上日志过滤,发现ld-linux的进行进行24802次切换,执行ps -ef pstree 却未发现该进程;


查看top链接到所在动态库有异常,【猜测黑客可能利用连接库的方式过滤程序所产生的进程或者利用其他os层面的bug进行过滤,导致无法查看到占用高的进程】
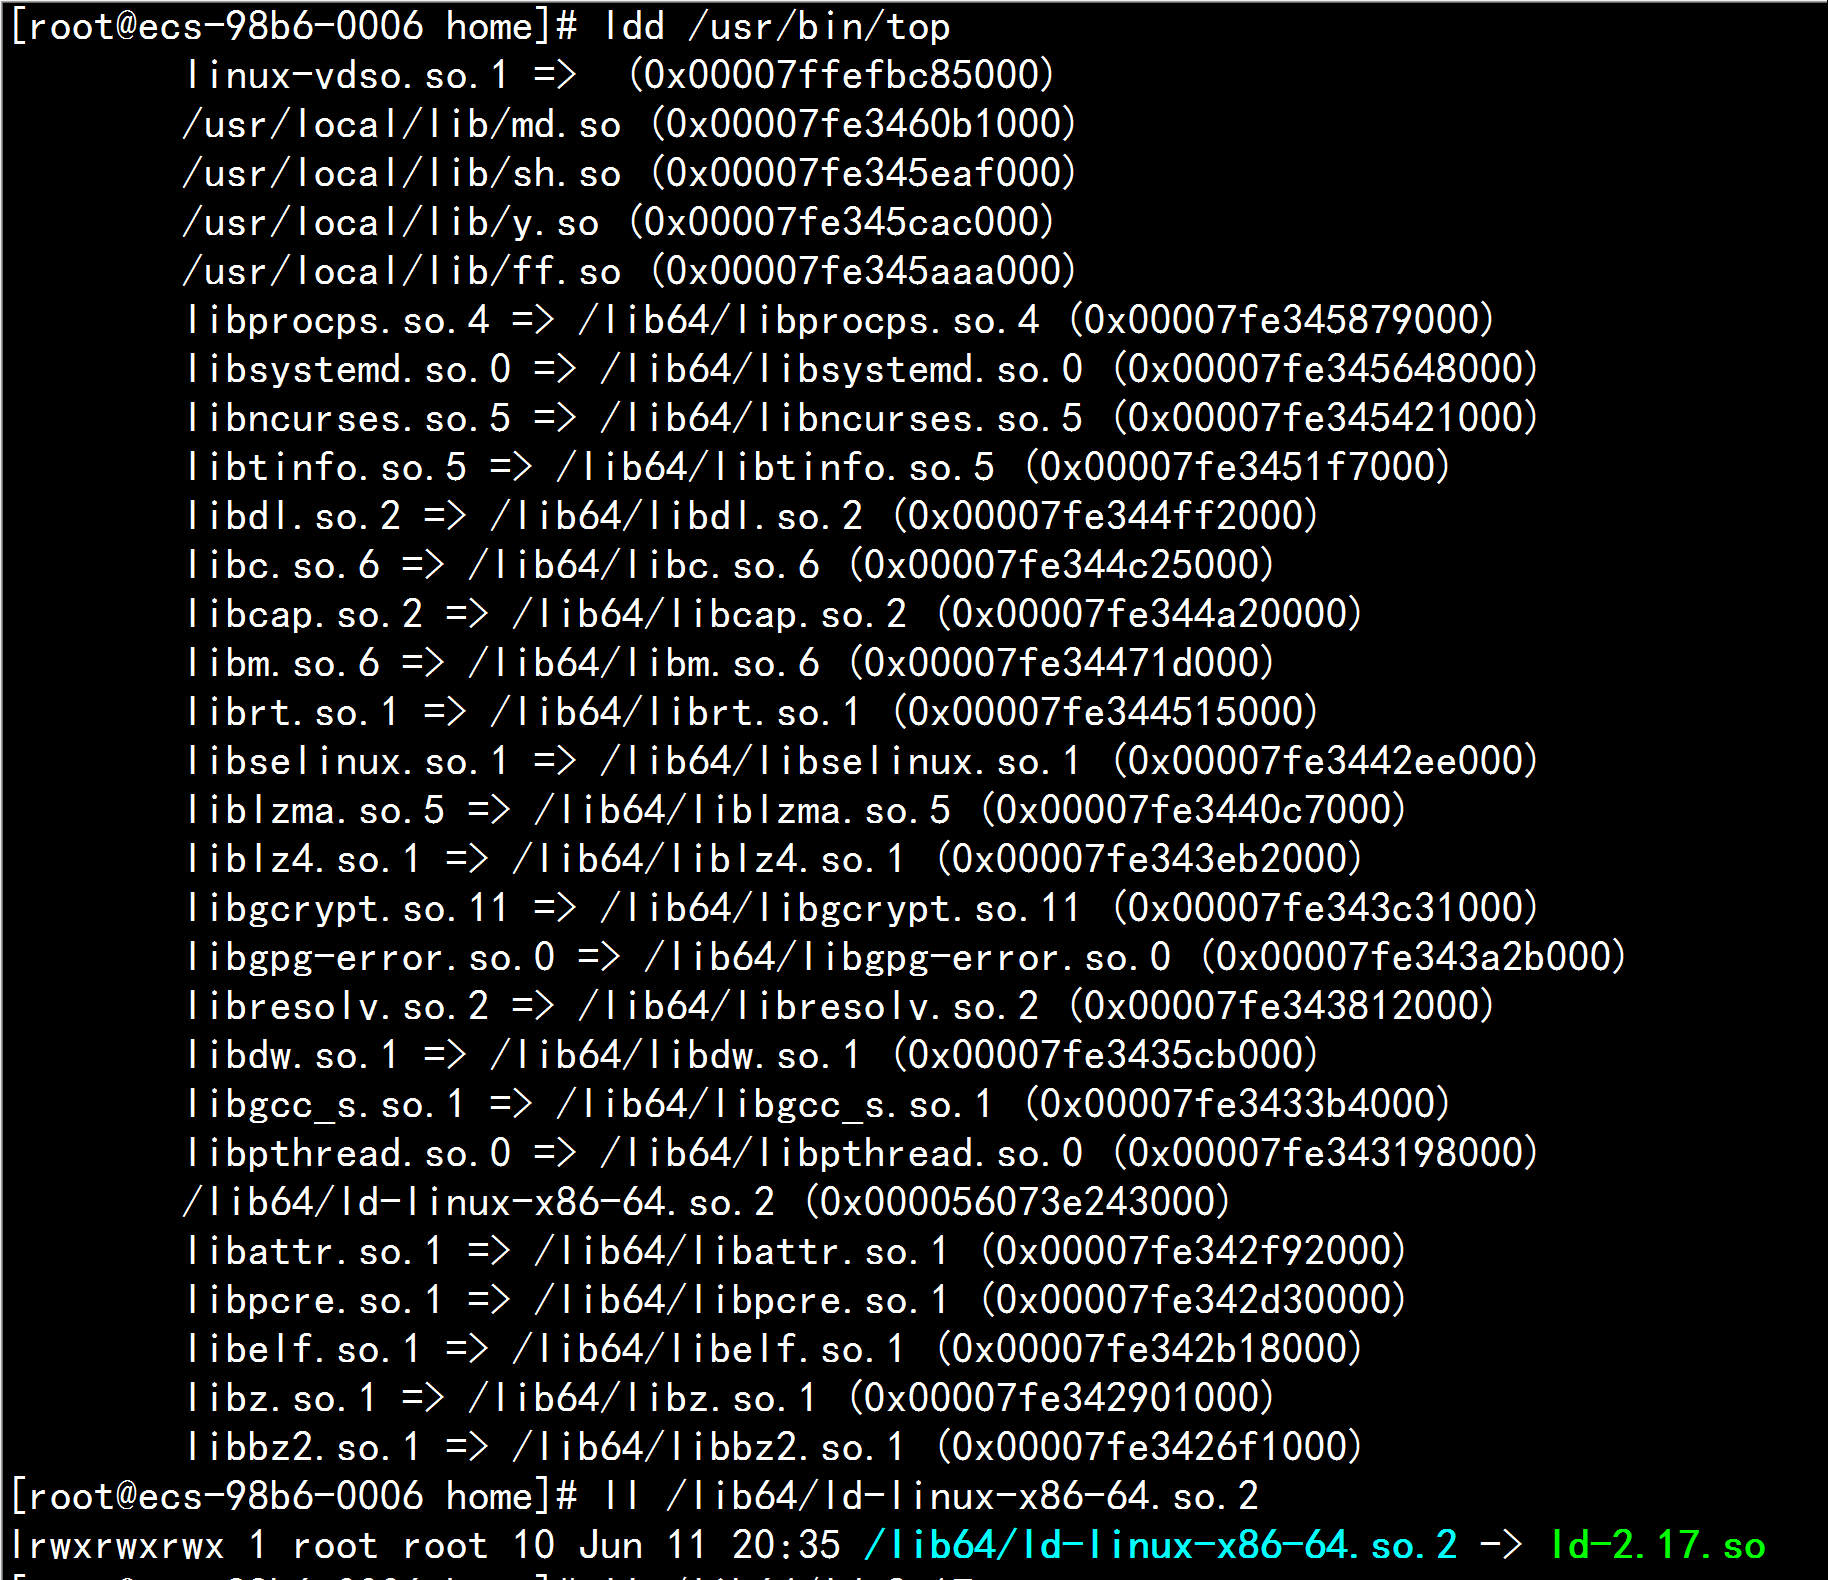
下载文件包后,文件依然无法执行,所以命令本身没有被修改;
[root@ecs-98b6-0006 home]# wget https://mirrors.tuna.tsinghua.edu.cn/centos/7.5.1804/os/x86_64/Packages/procps-ng-3.3.10-17.el7.x86_64.rpm
--2018-08-23 20:31:36-- https://mirrors.tuna.tsinghua.edu.cn/centos/7.5.1804/os/x86_64/Packages/procps-ng-3.3.10-17.el7.x86_64.rpm
Resolving mirrors.tuna.tsinghua.edu.cn (mirrors.tuna.tsinghua.edu.cn)... 101.6.8.193, 2402:f000:1:408:8100::1
Connecting to mirrors.tuna.tsinghua.edu.cn (mirrors.tuna.tsinghua.edu.cn)|101.6.8.193|:443... connected.
HTTP request sent, awaiting response... 200 OK
Length: 296372 (289K) [application/x-redhat-package-manager]
Saving to: ‘procps-ng-3.3.10-17.el7.x86_64.rpm’
100%[=====================================================================================================>] 296,372 --.-K/s in 0.07s
2018-08-23 20:31:37 (3.82 MB/s) - ‘procps-ng-3.3.10-17.el7.x86_64.rpm’ saved [296372/296372]
[root@ecs-98b6-0006 home]# ls
env procps-ng-3.3.10-17.el7.x86_64.rpm trace
[root@ecs-98b6-0006 home]# rpm -ivh procps-ng-3.3.10-17.el7.x86_64.rpm
^C^C^C^C[root@ecs-98b6-0006 home]# ^C
[root@ecs-98b6-0006 home]# rpm2cpio procps-ng-3.3.10-17.el7.x86_64.rpm | cpio -id
1496 blocks
[root@ecs-98b6-0006 home]# ls
env procps-ng-3.3.10-17.el7.x86_64.rpm trace usr
[root@ecs-98b6-0006 home]# usr/bin/ps aux | grep ld-linux
root 15935 0.0 0.0 123000 1032 pts/2 S+ 20:32 0:00 grep --color=auto ld-linux
[root@ecs-98b6-0006 home]# usr/bin/ps aux | grep ld-linux
root 15944 0.0 0.0 123000 1032 pts/2 S+ 20:32 0:00 grep --color=auto ld-linux
[root@ecs-98b6-0006 home]# usr/bin/ps aux | grep ld-linux
root 15948 0.0 0.0 123000 1032 pts/2 S+ 20:33 0:00 grep --color=auto ld-linux
[root@ecs-98b6-0006 home]# usr/bin/top
top - 20:33:43 up 145 days, 6:01, 1 user, load average: 0.00, 0.01, 0.05
Tasks: 151 total, 5 running, 146 sleeping, 0 stopped, 0 zombie
%Cpu(s): 99.8 us, 0.2 sy, 0.0 ni, 0.0 id, 0.0 wa, 0.0 hi, 0.0 si, 0.0 st
KiB Mem : 16242484 total, 7017344 free, 1572616 used, 7652524 buff/cache
KiB Swap: 4095996 total, 4095996 free, 0 used. 13602480 avail Mem
PID USER PR NI VIRT RES SHR S %CPU %MEM TIME+ COMMAND
16046 root 20 0 170200 2332 1620 R 0.6 0.0 0:00.05 top
120922 root 20 0 6860396 380620 16672 S 0.6 2.3 172:07.69 java
578 root 20 0 163376 5932 4556 S 0.3 0.0 0:00.40 sshd
15711 root 20 0 0 0 0 S 0.3 0.0 0:00.02 kworker/2:2
1 root 20 0 59972 3884 2480 S 0.0 0.0 2:15.50 systemd
2 root 20 0 0 0 0 S 0.0 0.0 0:00.84 kthreadd
3 root 20 0 0 0 0 S 0.0 0.0 0:00.30 ksoftirqd/0
5 root 0 -20 0 0 0 S 0.0 0.0 0:00.00 kworker/0:0H
7 root rt 0 0 0 0 S 0.0 0.0 0:08.75 migration/0
8 root 20 0 0 0 0 S 0.0 0.0 0:00.00 rcu_bh
9 root 20 0 0 0 0 R 0.0 0.0 8:38.89 rcu_sched
10 root rt 0 0 0 0 S 0.0 0.0 0:46.69 watchdog/0
11 root rt 0 0 0 0 S 0.0 0.0 0:43.63 watchdog/1
12 root rt 0 0 0 0 S 0.0 0.0 0:09.25 migration/1
13 root 20 0 0 0 0 S 0.0 0.0 0:00.21 ksoftirqd/1
15 root 0 -20 0 0 0 S 0.0 0.0 0:00.00 kworker/1:0H
16 root rt 0 0 0 0 S 0.0 0.0 0:40.44 watchdog/2
17 root rt 0 0 0 0 S 0.0 0.0 0:08.76 migration/2
18 root 20 0 0 0 0 S 0.0 0.0 0:00.17 ksoftirqd/2
20 root 0 -20 0 0 0 S 0.0 0.0 0:00.00 kworker/2:0H
21 root rt 0 0 0 0 S 0.0 0.0 0:40.02 watchdog/3
22 root rt 0 0 0 0 S 0.0 0.0 0:08.97 migration/3
ps:在定位另一台主机时候,发现主机一直向一个地址建立链接,经过查询,该IP为爱尔兰地址;

在定位过程中,未知哪个操作修复了客户top命令可以明确查询到ldd占用进程高,想要进一步查看的时候,被重启。。。funk。
