我们先来回顾一下,当我们构建因子时,目前有几种方式。
这里以过去5日成交总额因子举例说明:
-
根据因子库默认因子构建
-
运算符构建因子
-
表达式引擎构建因子
表达式引擎构建因子比较灵活,下列三种方式效果相同。
但是在策略开发过程中,有些因子比较难以构建,比如个股相对于上证50、或者中证800的超额收益率,这样的因子用刚刚提到的方式很难实现,因此今天又必要介绍如何通过自定义函数构建因子。本文以个股相对于中证800的超额收益率为例。
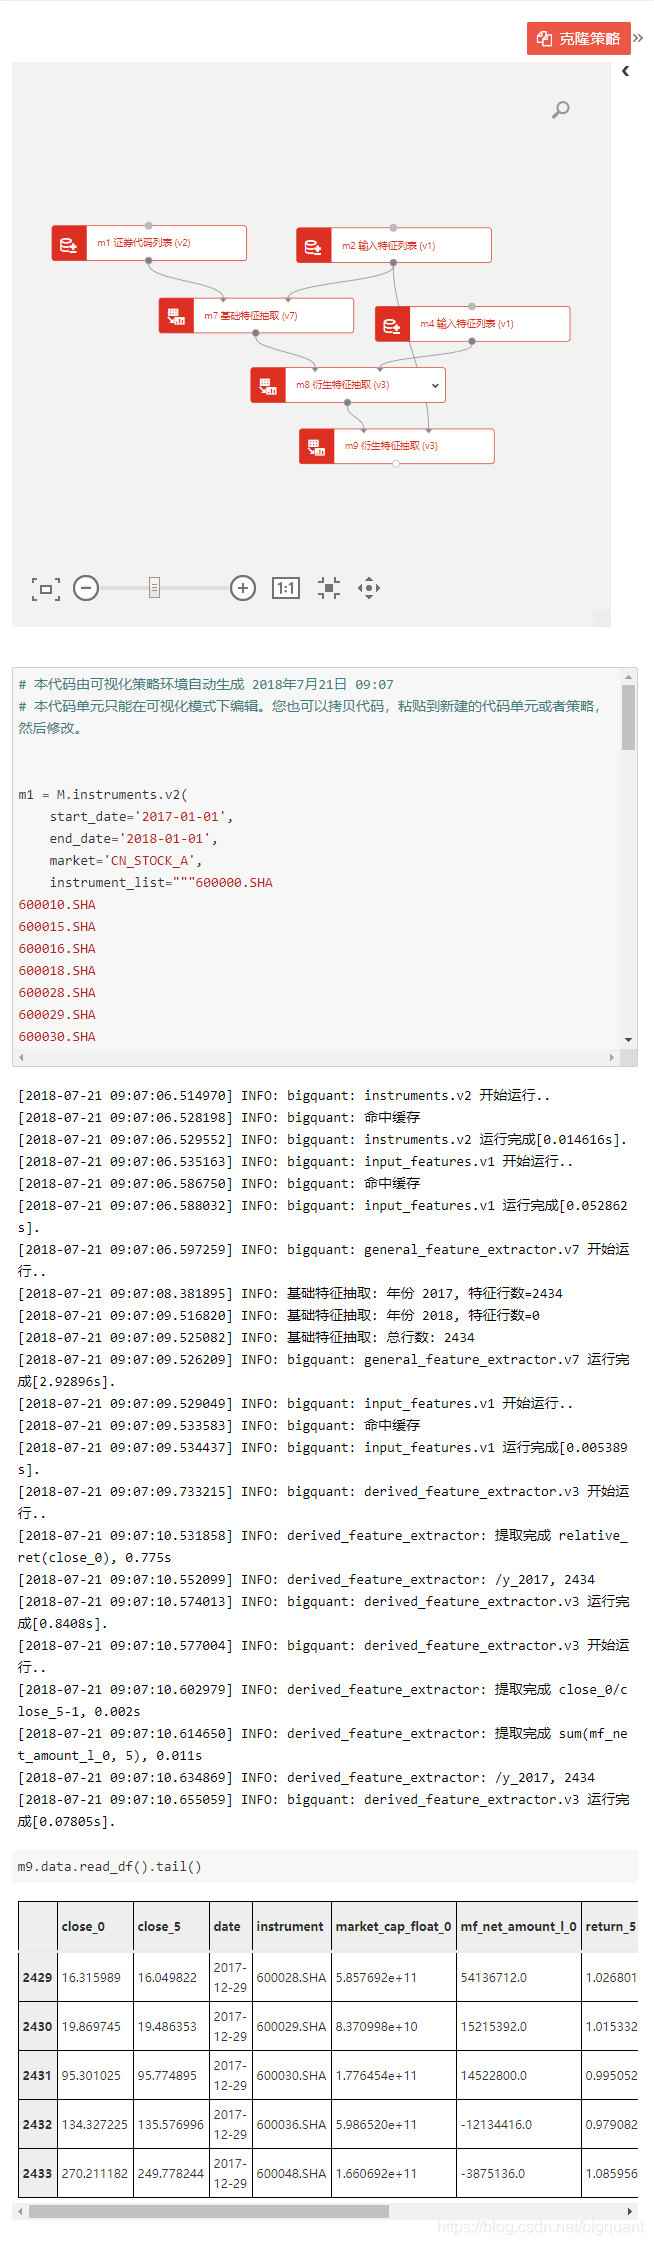
流程
-
拖入证券代码列表模块
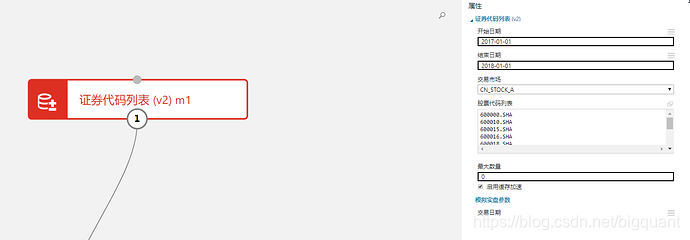
这里我们时间跨度为1年左右,为了减少运行时间,只输入了10只股票。
-
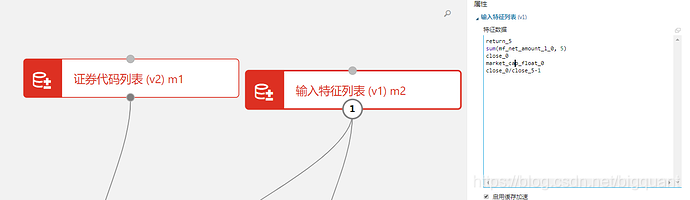
拖入 输入特征列表模块,并输入特征
-
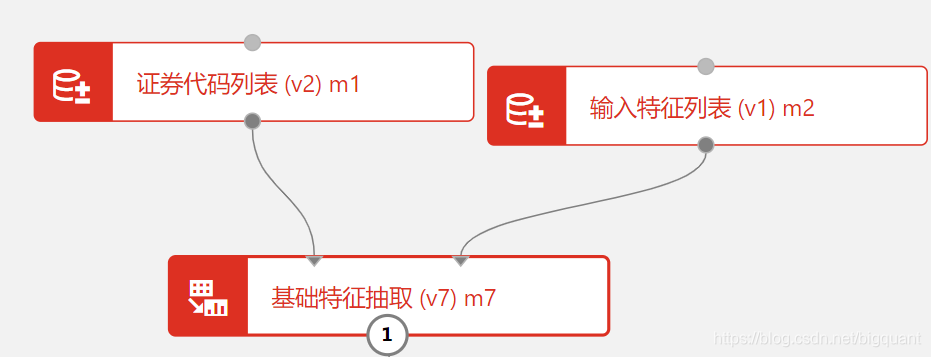
拖入 基础特征抽取模块,并连线。
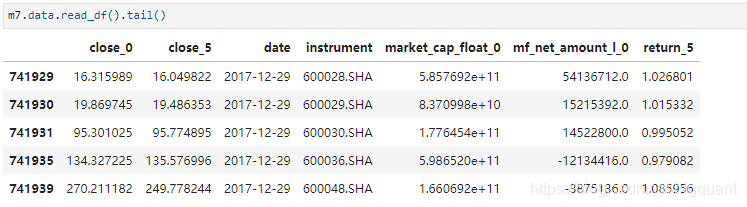
基础特征抽取结果如下:
-
拖入 输入特征列表模块,并输入个股相对中证800的超额收益率的特征名称
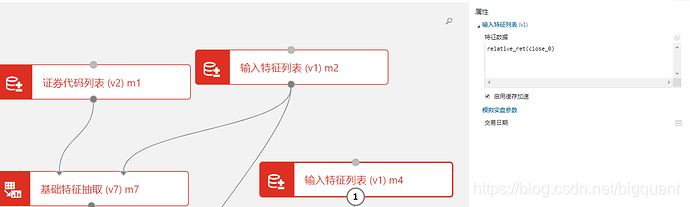
-
拖入衍生特征抽取模块,计算出个股相对中证800的超额收益率的特征名称
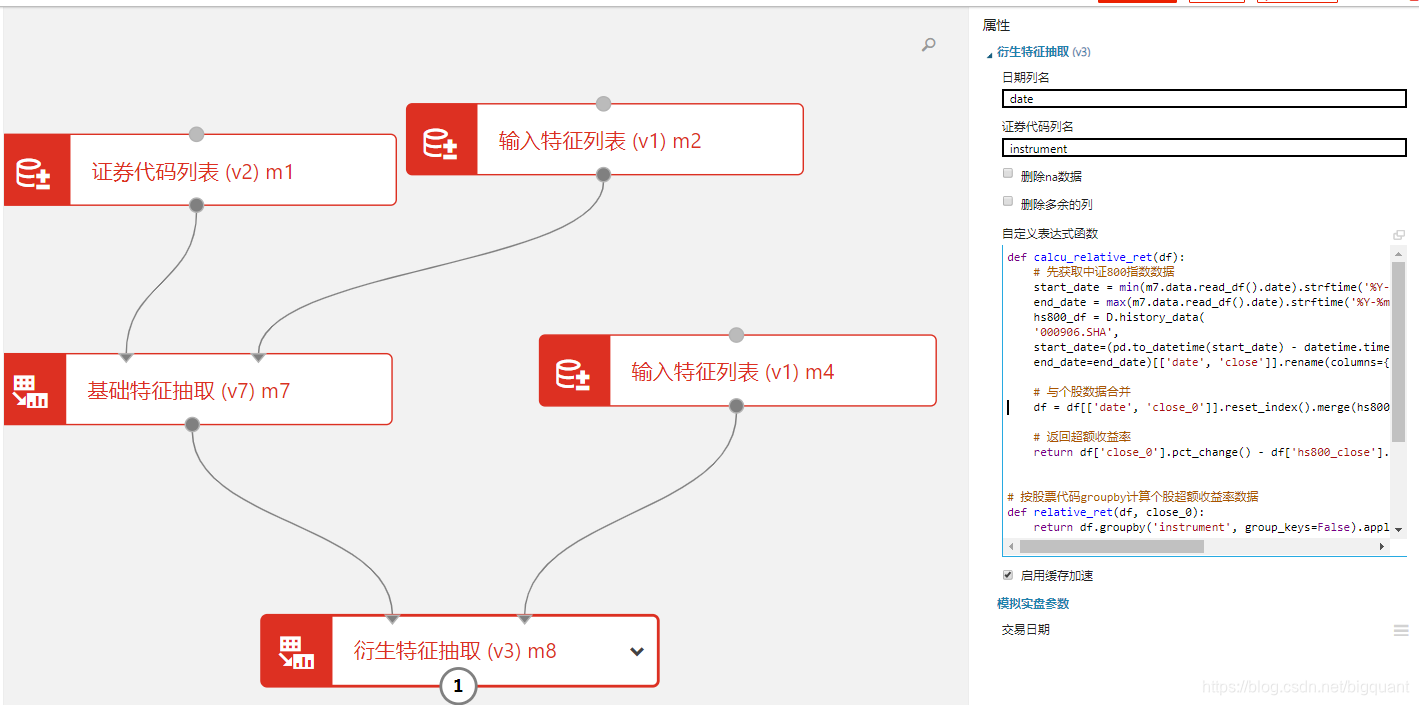
这里是全文最主要的地方,理解清楚就能非常自由灵活地构建因子。
这里详细讲解下:
bigquant_run = {
    'relative_ret':  relative_ret
}
代码解释:
在这里自定义表达式函数,为字典格式,例:{‘user_rank’:user_rank},字典的key是方法名称,字符串类型,字典的value是方法的引用,更多文档参考:衍生特征抽取
def relative_ret(df, close_0):
    return df.groupby('instrument', group_keys=False).apply(calcu_relative_ret)
代码解释:
计算特征需要先按股票代码进行groupby然后单独计算每只股票的特征数据。
def calcu_relative_ret(df):
    # 先获取中证800指数数据
    start_date = min(m7.data.read_df().date).strftime('%Y-%m-%d')
    end_date = max(m7.data.read_df().date).strftime('%Y-%m-%d')
    hs800_df = D.history_data(
    '000906.SHA',
    start_date=(pd.to_datetime(start_date) - datetime.timedelta(days=10)).strftime('%Y-%m-%d'),  # 多取几天的数据
    end_date=end_date)[['date', 'close']].rename(columns={'close': 'hs800_close'})

    # 与个股数据合并
    df = df[['date', 'close_0']].reset_index().merge(hs800_df, on='date', how='left').set_index('index')

    # 返回超额收益率
    return df['close_0'].pct_change() - df['hs800_close'].pct_change()
代码解释:
先根据开始日期和结束日期,通过平台的数据接口获取中证800的指数数据,然后将按股票代码groupby后的数据(个股数据)与中证800数据合并,最后在一个数据框中计算出超额收益率。
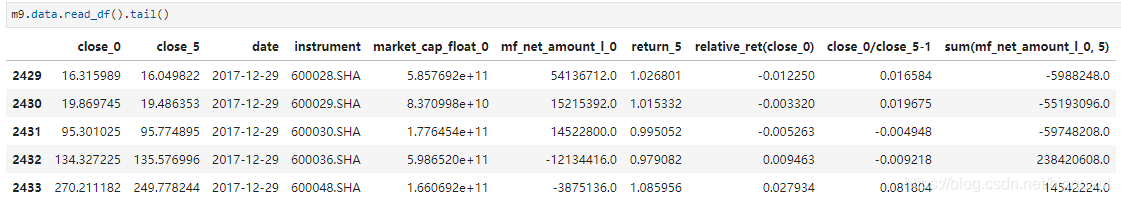
查看个股超额收益率特征:
p7|690x189
- 拖入衍生特征抽取模块,继续抽取其他特征
p8|690x382
查看最终的特征数据,该特征数据可直接和标注数据合并,训练模型。
欢迎大家 克隆进行研究:
- 实现平台:BigQuant—人工智能量化投资平台
- 源码地址:《自定义函数构建因子》
本文由BigQuant人工智能量化投资平台原创推出,版权归BigQuant所有,转载请注明出处。