版权声明:本文为博主原创文章,未经博主允许不得转载。 https://blog.csdn.net/sinat_31231955/article/details/81904922
前言及展示
在项目中需要根据传过来的数据画出流程图,采用了GOJS插件,功能很全面,可以根据自己的需要调整,不过建议简单的流程图还是自己手写一个组件,更加便于维护和变换。有一点需要注意的是,GOJS是需要收费的,有水印,虽然可以手动去掉,但是公司用的话还是需要买。GOJS的官网上有关于在VUE中应用GOJS的小例子:Minimal GoJS Sample in Vue.js。推荐看一下,可以解决大部分简单需求,这个例子可以满足你并行步骤数比较固定的二叉树画法的流程图。
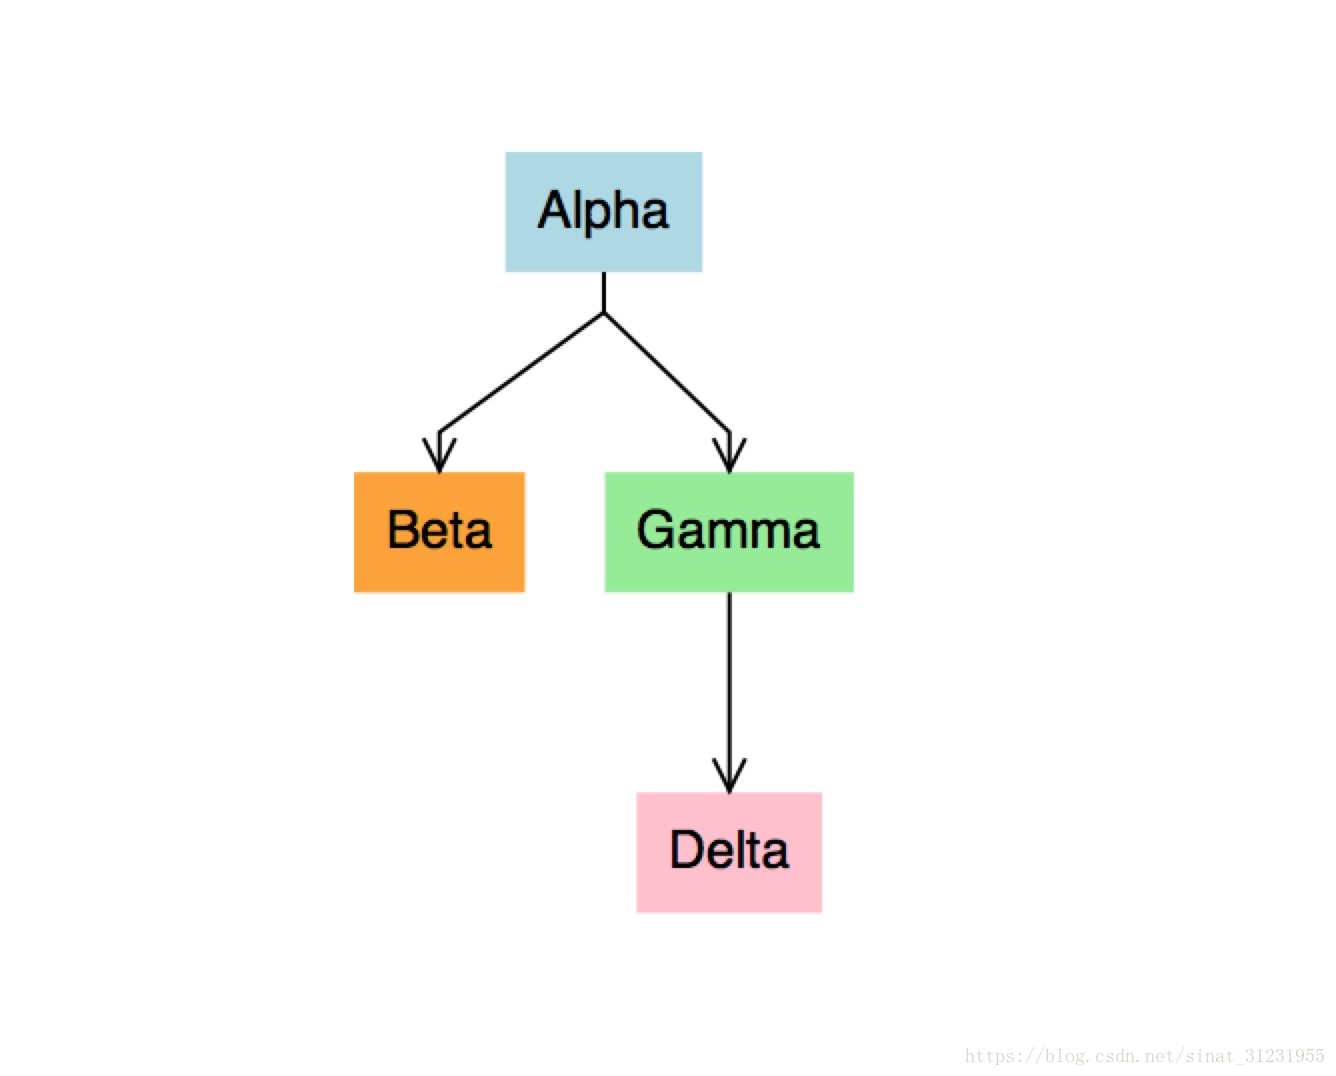
这是官网的例子,其中模块,线,箭头等画布元素都可以交互。
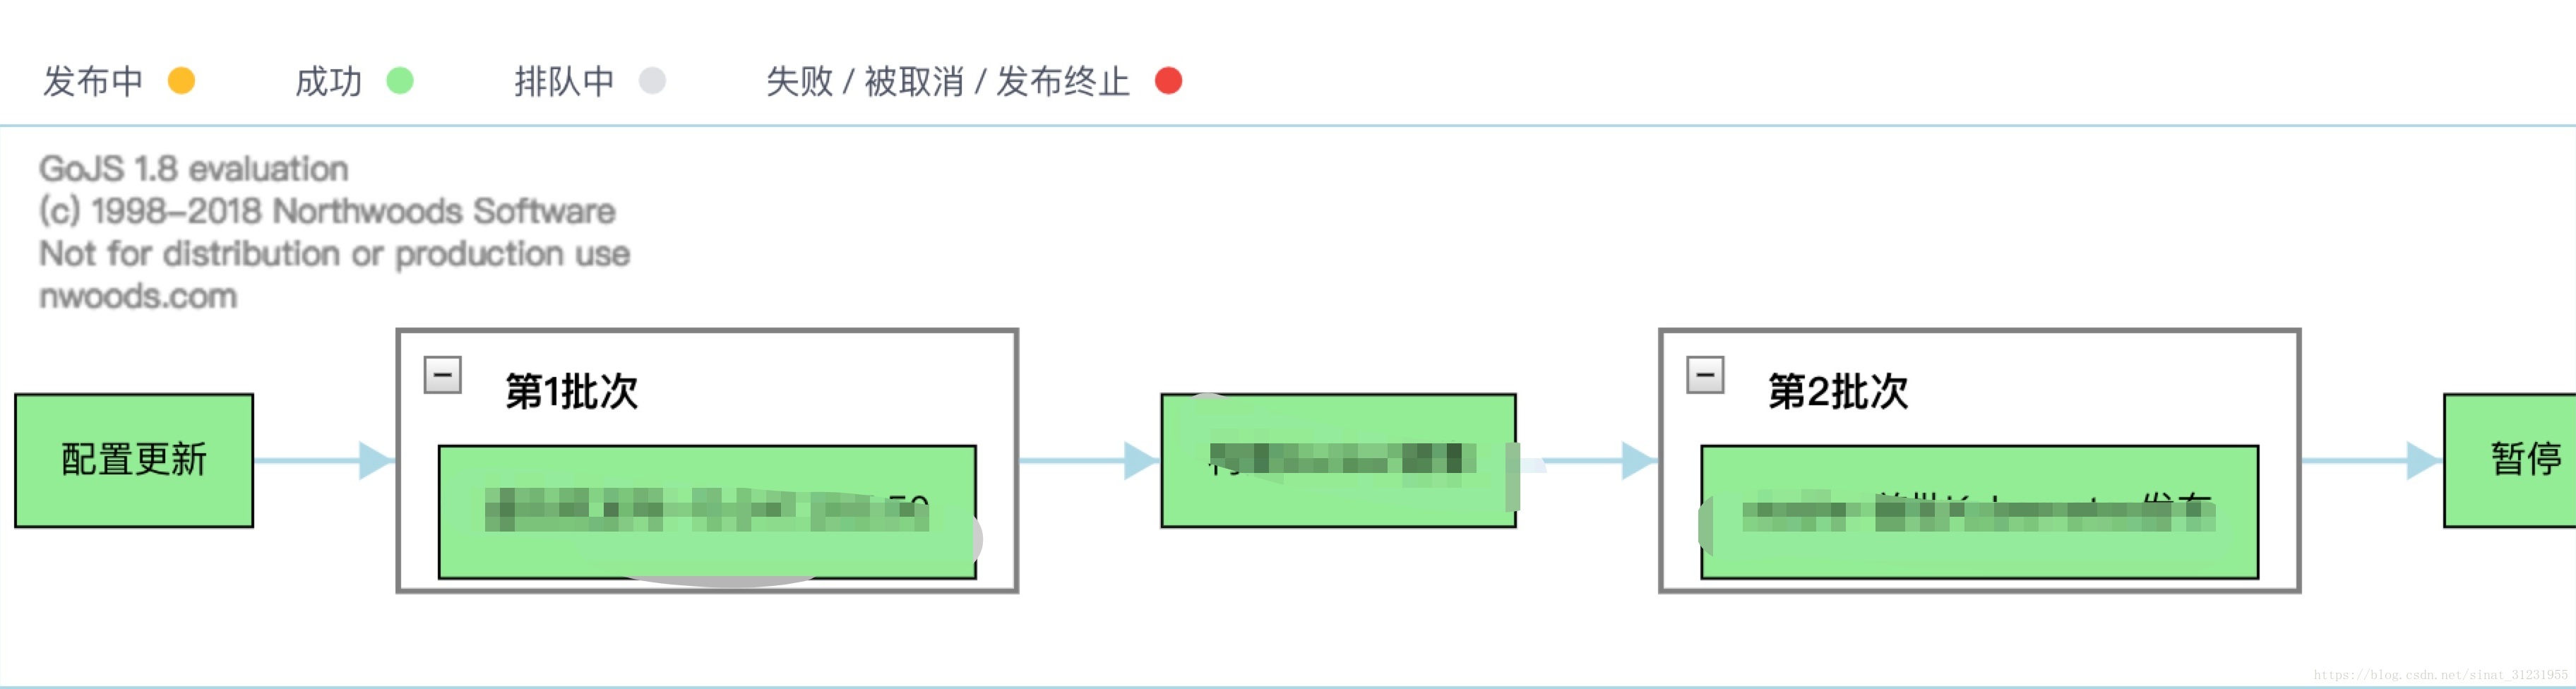
由于我的并行步骤数不固定,于是在图中加入了Group(组)。先展示一下成品:
其中批次中可以包含多个项目,表示并行的步骤。
具体实现
分为两个文件:
diagram.vue && stepMap.vue
diagram.vue声明组件,stepMap引用
diagram.vue
基本声明:
<script>
    import go from 'gojs';
    let $ = go.GraphObject.make;  // 后面很多用到该变量来初始化diagram
    export default{
      name: 'diagram',
      props: ['modelData'],  // accept model data as a parameter
      data() {
         return {
           diagram: null,
          };
        },  // provide access to the GoJS Diagram
初始化diagram:
      mounted: function() {
        let self = this;
        let myDiagram =
          $(go.Diagram, this.$el,
            {
              'initialContentAlignment': go.Spot.Center,
               'isEnabled': false,  // 是否可拖拽,默认为是
              // 'toolManager.mouseWheelBehavior': go.ToolManager.WheelNone,
              'allowLink': false,
              'allowMove': false,
              'allowRelink': false,  // 由于项目只想展示数据,我禁用了大部分图像交互操作,具体可参看官网API
              'layout': $(go.TreeLayout, {angle: 0, arrangement: go.TreeLayout.ArrangementHorizontal}),      // angle可控制图像展示方向
              'undoManager.isEnabled': true,
              // Model ChangedEvents get passed up to component users
              'ChangedSelection': function(e) {
                 self.$emit('changed-selection', e);
                },
            });

        myDiagram.nodeTemplate =  //  节点的初始化设置
          $(go.Node, 'Auto',
          $(go.Shape,  // 节点形状设置
            {
              fill: 'white', strokeWidth: 1,
              portId: '', fromLinkable: true, toLinkable: true, cursor: 'pointer',
            },
              new go.Binding('fill', '', this.nodeColorConverter)),  //  nodeColorConverter是我自定义函数,根据节点状态设置节点的背景颜色
            $(go.TextBlock,  //  节点提示文字设置
              {margin: 16, editable: false},
              new go.Binding('text').makeTwoWay())
          );

        myDiagram.linkTemplate =
          $(go.Link,
            {relinkableFrom: true, relinkableTo: true},
            $(go.Shape,  // 连线形状设置
            {strokeWidth: 2},
            new go.Binding('stroke', '', this.linkColorConverter)), // 连线的颜色设置
            $(go.Shape,  // arrowhead
            {toArrow: 'Triangle', stroke: null, scale: 1.5}, // 箭头设置
            new go.Binding('fill', '', this.linkColorConverter))
          );

        myDiagram.groupTemplate =   //  分组的初始化
            $(go.Group, 'Auto',
              { // define the group's internal layout
                layout: $(go.TreeLayout,
                          {angle: 90, arrangement: go.TreeLayout.ArrangementVertical, isRealtime: false}),
                // the group begins unexpanded;
                // upon expansion, a Diagram Listener will generate contents for the group
                // when a group is expanded, if it contains no parts, generate a subGraph inside of it
                // subGraphExpandedChanged: function(group) {
                //   if (group.memberParts.count === 0) {
                //     randomGroup(group.data.key);
                //   }
                // },
              },
            $(go.Shape, 'Rectangle',
              {fill: null, stroke: 'gray', strokeWidth: 2}),
            $(go.Panel, 'Vertical',
              {defaultAlignment: go.Spot.Left, margin: 4},
              $(go.Panel, 'Horizontal',
                {defaultAlignment: go.Spot.Top},
                $('SubGraphExpanderButton', {alignment: go.Spot.Top, margin: 5}),
                // the SubGraphExpanderButton is a panel that functions as a button to expand or collapse the subGraph
                $(go.TextBlock,
                  {
                    font: 'Bold 14px Sans-Serif',
                    margin: 10,
                  },
                  new go.Binding('text', 'text'))
              ),
            // create a placeholder to represent the area where the contents of the group are
              $(go.Placeholder,
                {padding: new go.Margin(0, 10)}),
            )  // end Vertical Panel
          );  // end Group

          // generate the initial model
        this.diagram = myDiagram;
        this.updateModel(this.modelData);
更新图中数据时需要的函数:
      watch: {
        modelData: function(val) {
          this.updateModel(val);
        },
      },
      methods: {
        model: function() {
          return this.diagram.model;
        },
        updateModel: function(val) {
          // No GoJS transaction permitted when replacing Diagram.model.
          if (val instanceof go.Model) {
            this.diagram.model = val;
          } else {
            let m = new go.GraphLinksModel();
            if (val) {
              for (let p in val) {
                if (val[p]) {
                  m[p] = val[p];
                }
              }
            }
            this.diagram.model = m;
          }
        },
        updateDiagramFromData: function() {
          this.diagram.startTransaction();
          // This is very general but very inefficient.
          // It would be better to modify the diagramData data by calling
          // Model.setDataProperty or Model.addNodeData, et al.
          this.diagram.updateAllRelationshipsFromData();
          this.diagram.updateAllTargetBindings();
          this.diagram.commitTransaction('updated');
        },
      },
    };
</script>
声明后在stepMap调用,比较重要的是这两个方法:
updateDiagramFromData: function() {
          this.$refs.diag.updateDiagramFromData();   // 数据变化时调用组件中的更新方法
        },
changedSelection: function(e) {
          let node = e.diagram.selection.first();
          if (node instanceof go.Node) {
            this.currentNode = node;
            this.currentNodeText = node.data.text;
            this.selectNode(node.data);
          } else {
            this.currentNode = null;
            this.currentNodeText = '';
          }
        },
最后,将需要展示的数据转化为需要的格式就可以啦。
流程图所需格式如下:
无分组:
 "nodeDataArray": [
{"key":1, "text":"Alpha", "color":"lightblue"},
{"key":2, "text":"Beta", "color":"orange"},
{"key":3, "text":"Gamma", "color":"lightgreen"},
{"key":4, "text":"Delta", "color":"pink"}
 ]
  "linkDataArray": [
{"from":1, "to":2},
{"from":1, "to":3},
{"from":3, "to":4}
 ]
有分组:
 var nodeDataArray = [
    { key: "Alpha" },
    { key: "Beta", group: "Omega" },
    { key: "Gamma", group: "Omega" },
    { key: "Omega", isGroup: true },
    { key: "Delta" }
  ];
  var linkDataArray = [
    { from: "Alpha", to: "Beta" },
    { from: "Beta", to: "Gamma" },
    { from: "Omega", to: "Delta" }
  ];