--> 问题背景
同事电话我,说oracle数据库很慢,很卡,cpu99%了。
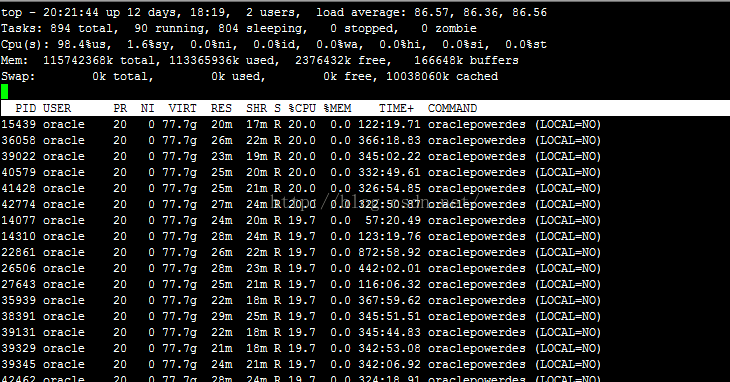
1,查看问题现场,cpu高单核不高,load高
多核,看到每个核只有20%左右使用了1/5,所以数据库应该没事,没有到故障级别,只是load高已经接近90了,E:\u\azure_cloud\oracle\05.png:
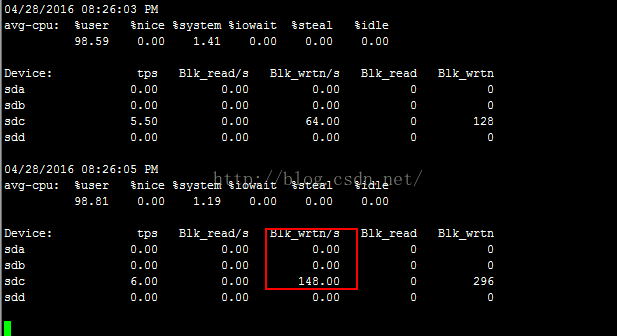
2,看io读写比较低,磁盘io不是瓶颈
实时观察,才148,可以看出io性能没有问题,毕竟是ssd磁盘,E:\u\azure_cloud\oracle\04.png:
3,查看锁表情况,比较少
select t2.username,t2.sid,t2.serial#,t2.logon_time fromv$locked_object t1,v$session t2 where t1.session_id=t2.sid order byt2.logon_time;执行没有记录。
SQL> select t2.username,t2.sid,t2.serial#,t2.logon_time from v$locked_object t1,v$session t2 where t1.session_id=t2.sid order by t2.logon_time; no rows selected SQL> |
原blog地址:http://blog.csdn.net/mchdba/article/details/51299062,谢绝转载。
4,查看session等待,没有等待
SQL> select /*+ rule */ lpad(' ', decode(t1.xidusn,0,3,0)) || t1.oracle_username user_name,o.owner,o.object_name,o.object_type,s.sid,s.serial#,p.spid from v$locked_object t1,dba_objects o, v$session s,v$process p where t1.object_id=o.object_id and t1.session_id=o.object_id and t1.session_id=s.sid 6 and s.paddr=p.addr; no rows selected SQL> |
5,查看到有很多inactive进程
# 查看inactive进程,kill掉这些进程 SELECT SID, SERIAL#,MODULE, STATUS FROM V$SESSION S WHERE S.USERNAME IS NOT NULL AND UPPER(S.PROGRAM) IN ('TOAD.EXE', 'W3WP.EXE') AND S.LAST_CALL_ET >= 60*60*2 AND S.STATUS = 'INACTIVE' ORDER BY SID DESC; # 通过如下sql获取kill命令: SELECT 'alter system kill session '''||SID||','|| SERIAL#||''';' FROM V$SESSION S WHERE S.USERNAME IS NOT NULL AND S.LAST_CALL_ET >= 10 AND S.STATUS = 'INACTIVE' ORDER BY S.MACHINE,SID DESC; |
Kill掉'INACTIVE' 进程后,db的load还是没有降下来,证明资源没有被释放掉。这么看来,根源在正在运行的sql,系统load 高 io低,说明系统cpu 耗费高,有大量的逻辑运算而且可能会有wait等待。
6,去查看wait_class等待,有大量cursor:mutex S事件
# 查询等待sql语句 SELECT t1.sid, t1.serial#, t1.username, t1.event, t2.sql_text, t1.sql_id, t1.seconds_in_wait, t1.program, t1.blocking_session, -- object_type || ': ' || object_name object, t1.wait_class, t1.state FROM v$session t1 LEFT OUTER JOIN v$sqlarea t2 on (t1.sql_id = t2.sql_id) --LEFT OUTER JOIN dba_objects t3 --ON (object_id = row_wait_obj#) where t1.wait_class <> 'Idle'; |
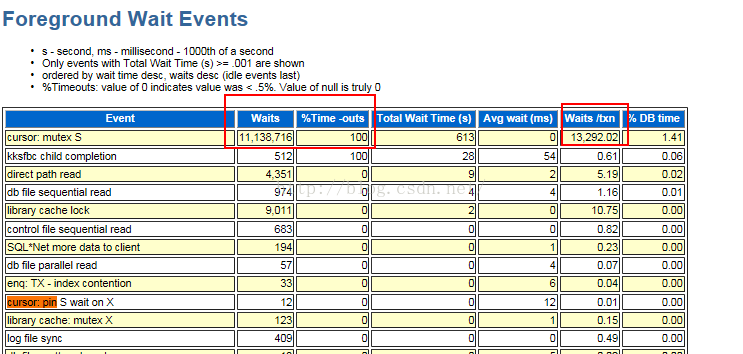
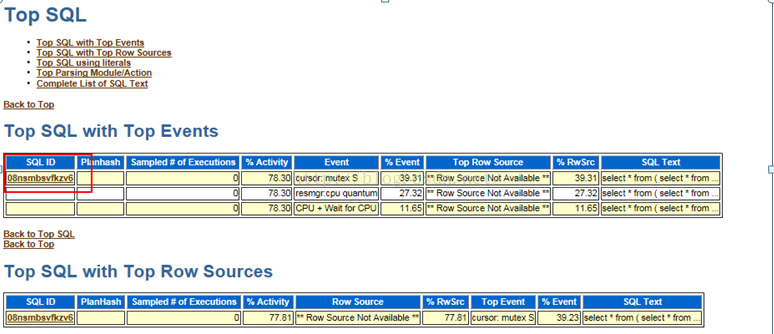
7,查看awr报告,也指向了cursor:mutex S
E:\u\azure_cloud\oracle\06.png
E:\u\azure_cloud\oracle\01.png

问题基本可以推测出来是cursor等待造成的
8,验证cursor_sharing参数为EXACT,正常
| SQL> show parameter cursor_sharing; NAME TYPE VALUE ------------------------------------ ----------- ------------------------------ cursor_sharing string EXACT SQL> |
9,查看4月28日今天的记录数是35W多,而且这个执行次数还在不停的增加中
select sql_id,count(*)
from dba_hist_active_sess_history
where event like'cursor: mutex S'and sample_time>to_date('28-04-201600:00:00', 'dd-mm-yyyyhh24:mi:ss')
groupby sql_id;
SQL> select sql_id,count(*) from dba_hist_active_sess_history where event like 'cursor: mutex S' and sample_time >to_date('28-04-2016 00:00:00', 'dd-mm-yyyy hh24:mi:ss') 4 group by sql_id; SQL_ID COUNT(*) ------------- ---------- 94508 8n23w37kwdn3p 1 08nsmbsvfkzv6 353543 SQL> |
10,查看昨天4月27日的记录数,才执行了3W多
select sql_id,count(*)
from dba_hist_active_sess_history
where event like'cursor: mutex S'and sample_time<to_date('28-04-201600:00:00', 'dd-mm-yyyyhh24:mi:ss') and sample_time>to_date('27-04-201600:00:00', 'dd-mm-yyyyhh24:mi:ss')
groupby sql_id;
SQL> select snap_id,ELAPSED_TIME_DELTA/EXECUTIONS_DELTA,CPU_TIME_DELTA/EXECUTIONS_DELTA,EXECUTIONS_DELTA from dba_hist_sqlstat where sql_id='08nsmbsvfkzv6' order by snap_id; no rows selected select sql_id,count(*) from dba_hist_active_sess_history where event like 'cursor: mutex S' and sample_time <to_date('28-04-2016 00:00:00', 'dd-mm-yyyy hh24:mi:ss') and sample_time >to_date('27-04-2016 00:00:00', 'dd-mm-yyyy hh24:mi:ss') 4 group by sql_id; SQL_ID COUNT(*) ------------- ---------- 11653 08nsmbsvfkzv6 38468 SQL> |
而昨天db数据库没有这么慢,这么卡,那么已经基本确定了是由于这今天爆发增长的几十万sql语句引起的cursor异常wait事件,接下来去找到这个具体的sql记录
11,通过sql_id(08nsmbsvfkzv6)查询到具体的sql记录
select sql_text from dba_hist_sqltext where sql_id='08nsmbsvfkzv6';
Sql太长了,截图截取不过来,贴出来如下:
select * from ( select * from ( (select (case when (instr(','||wm_concat(type)||',',',develop-plan,')>0) then 'develop-plan' else 'unRead' end) type, max(id) id,name,node_level,project,end,max(created_date) created_date, center,year_flg,sequence, min(isRead) isRead, MyReplace(wm_concat(msgCreateDate),',') msgCreateDate,wm_concat(group_name),max(planId),0 owe_days,0 owe_money from (select 'develop-plan' as type, node.node_id as id, template_node.node_name as name, template_node.node_level, project.project_name as project, node.schedule_end_date as end, warning.CREATED_DATE as created_date, '' as center , '' as year_flg, ROW_NUMBER() OVER(PARTITION BY node.templet_id, project.project_project_id ORDER BY warning.created_date ASC) as sequence, (select min(t.is_read) from plan6_message_user_read t where t.node_id=node.node_id and t.need_reader='baolm1' group by t.node_id) isRead, '' msgCreateDate,info.name group_name,info.biz_cd planId,0 owe_days,0 owe_money from plan6_warning warning, plan6_node node, project_distribution info,project_period pp, project_project project, plan6_templet_node template_node where warning.node_id = node.node_id and node.plan_id = info.biz_cd and info.project_period_id = pp.project_period_id and pp.is_enabled=1 and pp.project_project_id = project.project_project_id and template_node.node_id = node.templet_id and info.if_in_plan = 1 and (warning.charger_cd = 'baolm1' OR node.charger_cd='baolm1' OR node.center_manager_cd='baolm1' OR project.project_charger_cd='baolm1' OR project.project_charger_cd2='baolm1' OR project.project_charger_cd_bis='baolm1' OR ('wubc'='baolm1' AND template_node.node_level in(1,2) ) OR (('xuhf'='baolm1' OR 'zhanghf'='baolm1' ) and template_node.node_level=1) ) and warning.stat = 2 and node.status = 1 and node.is_enabled<>0 and warning.stat = 2 union select 'unRead' tyep,node.node_id id,template_node.node_name as name, template_node.node_level,project.project_name as project, node.schedule_end_date as end, to_date('','yyyymmdd hh24:mi:ss') as created_date, '' as center ,'' as year_flg, ROW_NUMBER() OVER(PARTITION BY node.templet_id, project.project_project_id ORDER BY r.created_date ASC) as sequence, r.is_read isRead,to_char(r.created_date,'yyyymmdd hh24:mi:ss') msgCreateDate,info.name group_name,info.biz_cd planId,0 owe_days,0 owe_money from plan6_message_user_read r,plan6_node node, project_distribution info,project_period pp,project_project project, plan6_templet_node template_node where r.node_id = node.node_id and node.plan_id = info.biz_cd and info.project_period_id = pp.project_period_id and pp.is_enabled=1 and pp.project_project_id = project.project_project_id and template_node.node_id = node.templet_id and info.if_in_plan = 1 and node.is_enabled<>0 and r.need_reader='baolm1' and r.is_read='0' ) warning where warning.sequence = 1 group by name,node_level,project,end,center,year_flg,sequence ) union (select 'oa_meeting' as type, metting.oa_meeting_id as id, TO_CHAR (metting.business) as name, 10 as node_level, '' as project, metting.target_date as end, warning.created_date as created_date, '' as center, '' as year_flg, 0 as sequence,'' isRead,'' msgCreateDate,'' group_name,'' planId,0 owe_days,0 owe_money from oa_meeting metting, plan_warning warning where metting.oa_meeting_id = warning.target and metting.HIDDEN_FLG = 0 and metting.status in (1,2, 4) and metting.target_date is not null and instr(';'||warning.responsible_person ,';baolm1;')>0 ) union (select 'work-center-plan' as type, cen.plan_work_center_id as id, cen.content as name, 10 as node_level, '' as project, cen.target_date as end, warning.created_date as created_date, '' center , '' year_flg, 0 as sequence,'' isRead,'' msgCreateDate,'' group_name,'' planId ,0 owe_days,0 owe_money from plan_work_center cen,plan_warning warning where cen.plan_work_center_id = warning.target and cen.status_cd in (1) and cen.open_type = '0' and cen.target_date is not null and instr(';'||cen.principal ,';baolm1;')>0) union (select 'project_detail' as type, pd.project_detail_id as id, pd.content as name,12 as node_level, '' as project, pd.target_date as end, pd.created_date as created_date,'' as center , '' as year_flag, 0 as sequence, '' isRead, '' msgCreateDate, '' group_name,'' planId,0 owe_days,0 owe_money from project_detail pd where pd.status in ('1','2','4') and pd.project_detail_id in (select pp.project_detail_id from project_principal pp where pp.principal_cd='baolm1'))) warning order by (case when type='work-zc-plan' then -1 else 1 end) asc, (case when type='unRead' then 0 else 1 end) asc, (case when isRead=0 then 0 else 1 end) asc, (case when msgCreateDate is not null then 0 else 1 end) asc, warning.type asc,(case when warning.node_level=0 then 4 else warning.node_level end) asc, trunc(warning.end)-trunc(sysdate) asc,warning.created_date desc,owe_money desc ) where rownum <= :1 |
By the way,基本可以肯定是这个sql引起的,那么除了这个sql是否还有别的记录呢,这需要现场实时观察。
12,分析当前的时间段记录
最近时间段的mutex记录都是'08nsmbsvfkzv6'这条sql引起的:
select sql_id,to_char(sample_time,'yyyy-mm-dd hh24:mi'),count(*) from dba_hist_active_sess_history where event like'cursor: mutex S' and sample_time > to_date('28-04-2016 22:30:00', 'dd-mm-yyyy hh24:mi:ss') AND sample_time < to_date('28-04-2016 23:10:00', 'dd-mm-yyyy hh24:mi:ss') groupby sql_id,to_char(sample_time,'yyyy-mm-dd hh24:mi') orderby sql_id,to_char(sample_time,'yyyy-mm-dd hh24:mi') desc; |
E:\u\azure_cloud\oracle\07.png

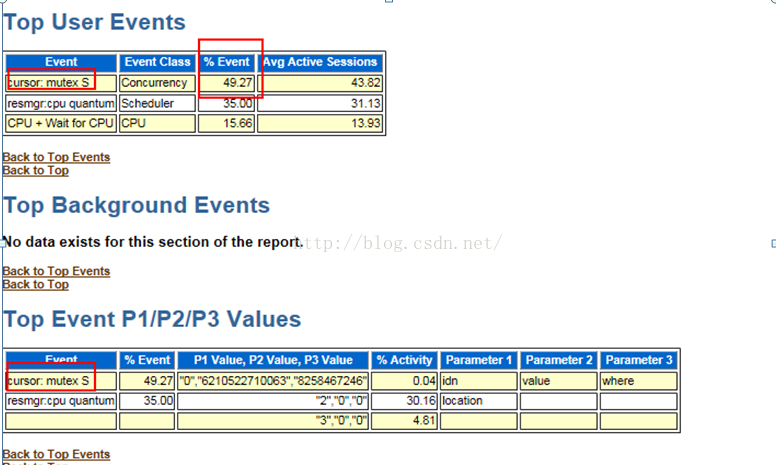
13,分析最近的ashrpt日志报告,最终验证
生成ashrpt_1_0428_2322.html,报告在附件里面,从等待事件可以看到,查看当前占用资源比较多的是cursor:mutex S,E:\u\azure_cloud\oracle\08.png

再从sql分析可以看到,是08nsmbsvfkzv6引起的,如下所示E:\u\azure_cloud\oracle\09.png
14,问题定位以及解决方案
检查'08nsmbsvfkzv6'的sql是在哪个业务模块,为啥今天突然暴增?去执行了'08nsmbsvfkzv6'的sql语句,里面有个绑定变量,我设置了100,试了下,执行速度很快,里面一条记录也没有,这估计和业务关系比较大吧。
3种解决方案:
(1)找到业务模块,是否可以停止。
(2)优化这条N多行的复杂的sql。
(3)升级oracle版本到11.2.0.4+
再分享一下我老师大神的人工智能教程吧。零基础!通俗易懂!风趣幽默!还带黄段子!希望你也加入到我们人工智能的队伍中来!https://blog.csdn.net/jiangjunshow