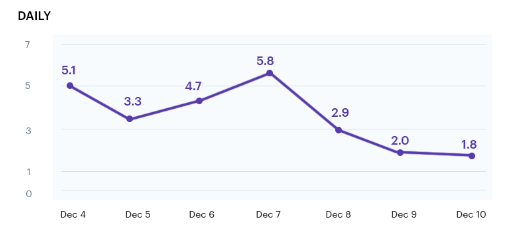
interface DataPoint {
  xAxisValue: string;
  yAxisValue: any;
}

 generateChart(data: DataPoint[]) {
    const width = 800;
    const height = 240;
    const padding = { left: 80, right: 20, top: 20, bottom: 30 };
    const circleRadius = 3;
    const percentageFormat = this.metricTypeID === 8 ? true : false;
    // add svg
    const svg = d3.select(`#${this.LineChartId}`)
      .append('svg')
      .attr('preserveAspectRatio', 'xMinYMin meet')
      .attr('viewBox', `0 0 ${width} ${height}`);

    // Scale
    const xScale = d3.scalePoint()
      .domain(data.map((d) => d.xAxisValue))
      .range([0, width - padding.left - padding.right])
      .padding(0.5);

    const yScale = d3.scaleLinear()
        .domain([0, d3.max(data, d => d.yAxisValue)])
        .range([height - padding.top - padding.bottom, 0])
        .nice();

    // add Axis into SVG
    const xAxis = d3.axisBottom(xScale).tickSize(0);
    let yAxis;
    if ( percentageFormat) {
       yAxis = d3.axisLeft(yScale).ticks(3).tickSize(-(width - padding.left - padding.right)).tickFormat(d3.format('.0%'));
    } else {
      yAxis = d3.axisLeft(yScale).ticks(3).tickSize(-(width - padding.left - padding.right));
    }

    svg.append('g')
      .attr('class', 'x axis')
      .attr('transform', `translate(${padding.left}, ${height - padding.bottom})`)
      .call(xAxis)
      .attr('font-family', 'Arial')
      .attr('font-size', '12px')
      .selectAll('.x.axis .tick text')
      .attr('y', 10);

    // add grid line
    svg.append('g')
      .attr('class', 'grid')
      .attr('transform', `translate(${padding.left}, ${padding.top})`)
      .call(yAxis)
      .attr('fill', 'rgb(248,251,254)');

    d3.selectAll('.grid .tick text')
      .attr('font-family', 'Arial')
      .attr('font-size', '12px')
      .attr('fill', 'rgb(141, 139, 139)')
      .attr('x', -15);

    d3.selectAll('.grid .tick line')
      .attr('stroke', 'rgb(141, 139, 139)')
      .attr('stroke-width', '1px');

    // remove y axis line
    svg.selectAll('.grid path')
      .attr('stroke-width', '0');

    // add line into svg
    const line = d3.line<DataPoint>()
      .x(d => xScale(d.xAxisValue))
      .y(d => yScale(d.yAxisValue));
    const lines = svg.append('g')
      .attr('class', 'lines')
      .attr('transform', `translate(${padding.left}, ${padding.top})`);

    lines.selectAll('line-group')
      .data(data)
      .enter()
      .append('g')
      .attr('class', 'line-group')
      .append('path')
      .attr('class', 'line')
      .attr('fill', 'none')
      .attr('d', line(data))
      .attr('stroke', this.color)
      .attr('stroke-width', '2px');

    // Add circle in the line

    lines.selectAll('circle')
      .data(data)
      .enter()
      .append('g')
      .attr('class', 'circle')
      .each((d, i, n) => {
        d3.select(n[i])
          .append('circle')
          .attr('cx', xScale(d.xAxisValue))
          .attr('cy', yScale(d.yAxisValue))
          .attr('fill', this.color)
          .attr('r', circleRadius);
        d3.select(n[i])
          .append('text')
          .text(percentageFormat ? `${d3.format('~%')(d.yAxisValue)}` : d.yAxisValue)
          .attr('x', xScale(d.xAxisValue))
          .attr('y', yScale(d.yAxisValue) - 8)
          .attr('fill', this.color)
          .attr('font-family', 'Arial')
          .attr('font-weight', '900')
          .attr('font-size', '16px')
          .attr('text-anchor', 'middle');
      });
  }
