需要的jar包:
jfreechart-1.0.17.jar
jcommon-1.0.24.jar
(jfreechart一般只要1.0系列的都可以,jcommon一般任何版本都可以)
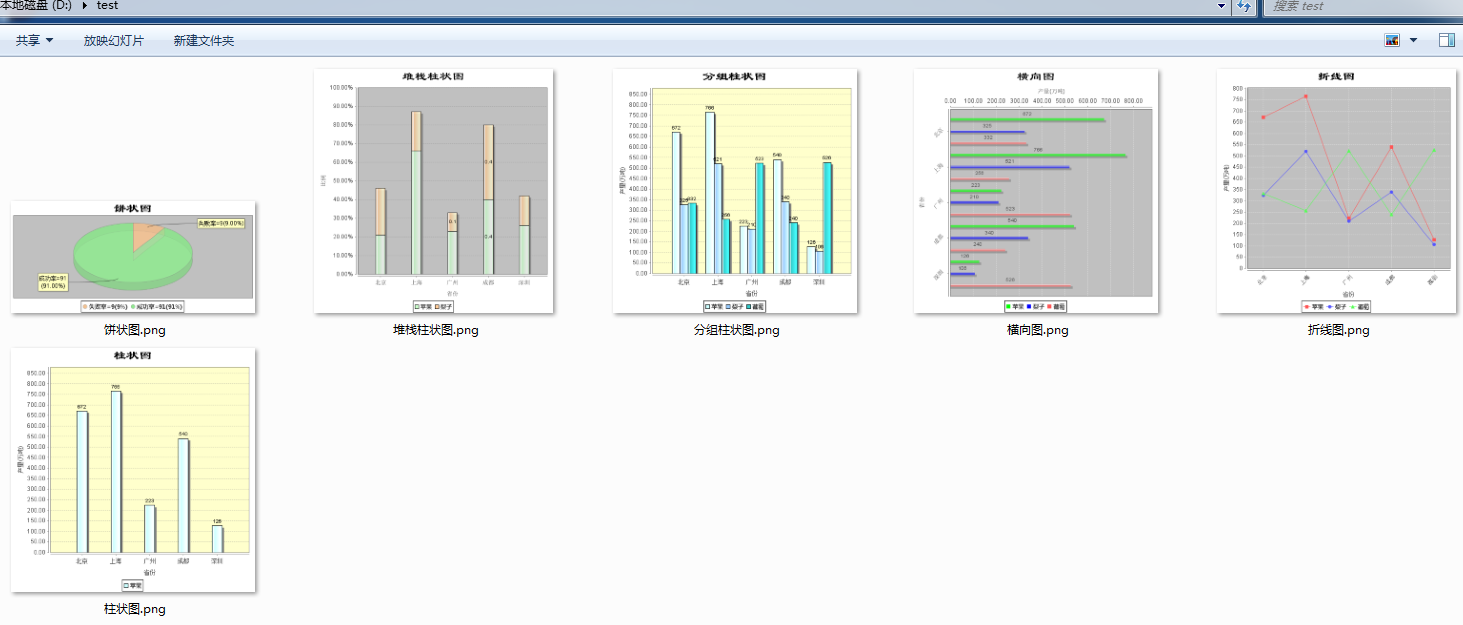
效果:
代码:
JfreechartUtil:
package jfreeChart; import java.awt.Color; import java.awt.Font; import java.io.File; import java.io.FileOutputStream; import java.text.DecimalFormat; import java.text.NumberFormat; import org.jfree.chart.ChartFactory; import org.jfree.chart.ChartUtilities; import org.jfree.chart.JFreeChart; import org.jfree.chart.axis.CategoryAxis; import org.jfree.chart.axis.CategoryLabelPositions; import org.jfree.chart.axis.NumberAxis; import org.jfree.chart.axis.ValueAxis; import org.jfree.chart.labels.StandardCategoryItemLabelGenerator; import org.jfree.chart.labels.StandardPieSectionLabelGenerator; import org.jfree.chart.plot.CategoryPlot; import org.jfree.chart.plot.PiePlot3D; import org.jfree.chart.plot.PlotOrientation; import org.jfree.chart.renderer.category.BarRenderer; import org.jfree.chart.renderer.category.LineAndShapeRenderer; import org.jfree.chart.renderer.category.StackedBarRenderer; import org.jfree.chart.title.TextTitle; import org.jfree.data.category.CategoryDataset; import org.jfree.data.general.DatasetUtilities; import org.jfree.data.general.DefaultPieDataset; import org.jfree.data.general.PieDataset; public class JfreechartUtil { private static final String CHART_PATH = "D:/test/"; public static void main(String[] args) { // TODO Auto-generated method stub JfreechartUtil pm = new JfreechartUtil(); // 生成饼状图 pm.makePieChart(); // 生成单组柱状图 pm.makeBarChart(); // 生成多组柱状图 pm.makeBarGroupChart(); // 生成横向图 pm.makeHorizontalBarChart(); // 生成堆栈柱状图 pm.makeStackedBarChart(); // 生成折线图 pm.makeLineAndShapeChart(); } /** * * 生成折线图 * */ public void makeLineAndShapeChart() { double[][] data = new double[][] { { 672, 766, 223, 540, 126 }, { 325, 521, 210, 340, 106 }, { 332, 256, 523, 240, 526 } }; String[] rowKeys = { "苹果", "梨子", "葡萄" }; String[] columnKeys = { "北京", "上海", "广州", "成都", "深圳" }; CategoryDataset dataset = getBarData(data, rowKeys, columnKeys); createTimeXYChar("折线图", "省份", "产量(万吨)", dataset, "折线图.png"); } /** * * 生成分组的柱状图 * */ public void makeBarGroupChart() { double[][] data = new double[][] { { 672, 766, 223, 540, 126 }, { 325, 521, 210, 340, 106 }, { 332, 256, 523, 240, 526 } }; String[] rowKeys = { "苹果", "梨子", "葡萄" }; String[] columnKeys = { "北京", "上海", "广州", "成都", "深圳" }; CategoryDataset dataset = getBarData(data, rowKeys, columnKeys); createBarChart(dataset, "省份", "产量(万吨)", "分组柱状图", "分组柱状图.png"); } /** * * 生成柱状图 * */ public void makeBarChart() { double[][] data = new double[][] { { 672, 766, 223, 540, 126 } }; String[] rowKeys = { "苹果" }; String[] columnKeys = { "北京", "上海", "广州", "成都", "深圳" }; CategoryDataset dataset = getBarData(data, rowKeys, columnKeys); createBarChart(dataset, "省份", "产量(万吨)", "柱状图", "柱状图.png"); } /** * * 生成横向柱状图 * */ public void makeHorizontalBarChart() { double[][] data = new double[][] { { 672, 766, 223, 540, 126 }, { 325, 521, 210, 340, 106 }, { 332, 256, 523, 240, 526 } }; String[] rowKeys = { "苹果", "梨子", "葡萄" }; String[] columnKeys = { "北京", "上海", "广州", "成都", "深圳" }; CategoryDataset dataset = getBarData(data, rowKeys, columnKeys); createHorizontalBarChart(dataset, "省份", "产量(万吨)", "横向图", "横向图.png"); } /** * * 生成堆栈柱状图 * */ public void makeStackedBarChart() { double[][] data = new double[][] { { 0.21, 0.66, 0.23, 0.40, 0.26 }, { 0.25, 0.21, 0.10, 0.40, 0.16 } }; String[] rowKeys = { "苹果", "梨子" }; String[] columnKeys = { "北京", "上海", "广州", "成都", "深圳" }; CategoryDataset dataset = getBarData(data, rowKeys, columnKeys); createStackedBarChart(dataset, "省份", "比例", "堆栈柱状图", "堆栈柱状图.png"); // return createStackedBarChart(dataset, "x坐标", "y坐标", "柱状图"); } /** * * 生成饼状图 * */ public void makePieChart() { double[] data = { 9, 91 }; String[] keys = { "失败率", "成功率" }; createValidityComparePimChar(getDataPieSetByUtil(data, keys), "饼状图", "饼状图.png", keys); } // 柱状图,折线图 数据集 public CategoryDataset getBarData(double[][] data, String[] rowKeys, String[] columnKeys) { return DatasetUtilities .createCategoryDataset(rowKeys, columnKeys, data); } // 饼状图 数据集 public PieDataset getDataPieSetByUtil(double[] data, String[] datadescription) { if (data != null && datadescription != null) { if (data.length == datadescription.length) { DefaultPieDataset dataset = new DefaultPieDataset(); for (int i = 0; i < data.length; i++) { dataset.setValue(datadescription[i], data[i]); } return dataset; } } return null; } /** * * 柱状图 * * * * @param dataset * * 数据集 * * @param xName * * x轴的说明(如种类,时间等) * * @param yName * * y轴的说明(如速度,时间等) * * @param chartTitle * * 图标题 * * @param charName * * 生成图片的名字 * * @return * */ public String createBarChart(CategoryDataset dataset, String xName, String yName, String chartTitle, String charName) { JFreeChart chart = ChartFactory.createBarChart(chartTitle, // 图表标题 xName, // 目录轴的显示标签 yName, // 数值轴的显示标签 dataset, // 数据集 PlotOrientation.VERTICAL, // 图表方向:水平、垂直 true, // 是否显示图例(对于简单的柱状图必须是false) false, // 是否生成工具 false // 是否生成URL链接 ); // 设置图标题的字体重新设置title Font font = new Font("隶书", Font.BOLD, 25); TextTitle title = new TextTitle(chartTitle); title.setFont(font); chart.setTitle(title); Font labelFont = new Font("SansSerif", Font.TRUETYPE_FONT, 12); // 设置图表下方的图例说明字体 chart.getLegend().setItemFont(new Font("微软雅黑", Font.BOLD, 12)); /* * * VALUE_TEXT_ANTIALIAS_OFF表示将文字的抗锯齿关闭, * * 使用的关闭抗锯齿后,字体尽量选择12到14号的宋体字,这样文字最清晰好看 * */ // chart.getRenderingHints().put(RenderingHints.KEY_TEXT_ANTIALIASING,RenderingHints.VALUE_TEXT_ANTIALIAS_OFF); chart.setTextAntiAlias(false); chart.setBackgroundPaint(Color.white); // create plot CategoryPlot plot = chart.getCategoryPlot(); // 设置横虚线可见 plot.setRangeGridlinesVisible(true); // 虚线色彩 plot.setRangeGridlinePaint(Color.gray); // 数据轴精度 NumberAxis vn = (NumberAxis) plot.getRangeAxis(); // vn.setAutoRangeIncludesZero(true); DecimalFormat df = new DecimalFormat("#0.00"); vn.setNumberFormatOverride(df); // 数据轴数据标签的显示格式 // x轴设置 CategoryAxis domainAxis = plot.getDomainAxis(); domainAxis.setLabelFont(labelFont);// 轴标题 domainAxis.setTickLabelFont(labelFont);// 轴数值 // Lable(Math.PI/3.0)度倾斜 // domainAxis.setCategoryLabelPositions(CategoryLabelPositions // .createUpRotationLabelPositions(Math.PI / 3.0)); domainAxis.setMaximumCategoryLabelWidthRatio(0.6f);// 横轴上的 Lable 是否完整显示 // 设置距离图片左端距离 domainAxis.setLowerMargin(0.1); // 设置距离图片右端距离 domainAxis.setUpperMargin(0.1); // 设置 columnKey 是否间隔显示 // domainAxis.setSkipCategoryLabelsToFit(true); plot.setDomainAxis(domainAxis); // 设置柱图背景色(注意,系统取色的时候要使用16位的模式来查看颜色编码,这样比较准确) plot.setBackgroundPaint(new Color(255, 255, 204)); // y轴设置 ValueAxis rangeAxis = plot.getRangeAxis(); rangeAxis.setLabelFont(labelFont); rangeAxis.setTickLabelFont(labelFont); // 设置最高的一个 Item 与图片顶端的距离 rangeAxis.setUpperMargin(0.15); // 设置最低的一个 Item 与图片底端的距离 rangeAxis.setLowerMargin(0.15); plot.setRangeAxis(rangeAxis); BarRenderer renderer = new BarRenderer(); // 设置柱子宽度 renderer.setMaximumBarWidth(0.05); // 设置柱子高度 renderer.setMinimumBarLength(0.2); // 设置柱子边框颜色 renderer.setBaseOutlinePaint(Color.BLACK); // 设置柱子边框可见 renderer.setDrawBarOutline(true); // // 设置柱的颜色 renderer.setSeriesPaint(0, new Color(204, 255, 255)); renderer.setSeriesPaint(1, new Color(153, 204, 255)); renderer.setSeriesPaint(2, new Color(51, 204, 204)); // 设置每个地区所包含的平行柱的之间距离 renderer.setItemMargin(0.0); // 显示每个柱的数值,并修改该数值的字体属性 renderer.setIncludeBaseInRange(true); renderer.setBaseItemLabelGenerator(new StandardCategoryItemLabelGenerator()); renderer.setBaseItemLabelsVisible(true); plot.setRenderer(renderer); // 设置柱的透明度 plot.setForegroundAlpha(1.0f); FileOutputStream fos_jpg = null; try { isChartPathExist(CHART_PATH); String chartName = CHART_PATH + charName; fos_jpg = new FileOutputStream(chartName); ChartUtilities.writeChartAsPNG(fos_jpg, chart, 500, 500, true, 10); return chartName; } catch (Exception e) { e.printStackTrace(); return null; } finally { try { fos_jpg.close(); } catch (Exception e) { e.printStackTrace(); } } } /** * * 横向图 * * * * @param dataset * * 数据集 * * @param xName * * x轴的说明(如种类,时间等) * * @param yName * * y轴的说明(如速度,时间等) * * @param chartTitle * * 图标题 * * @param charName * * 生成图片的名字 * * @return * */ public String createHorizontalBarChart(CategoryDataset dataset, String xName, String yName, String chartTitle, String charName) { JFreeChart chart = ChartFactory.createBarChart(chartTitle, // 图表标题 xName, // 目录轴的显示标签 yName, // 数值轴的显示标签 dataset, // 数据集 PlotOrientation.HORIZONTAL, // 图表方向:水平、垂直 true, // 是否显示图例(对于简单的柱状图必须是false) false, // 是否生成工具 false // 是否生成URL链接 ); // 设置图标题的字体重新设置title Font font = new Font("隶书", Font.BOLD, 25); TextTitle title = new TextTitle(chartTitle); title.setFont(font); chart.setTitle(title); Font labelFont = new Font("SansSerif", Font.TRUETYPE_FONT, 12); // 设置图表下方的图例说明字体 chart.getLegend().setItemFont(new Font("微软雅黑", Font.BOLD, 12)); CategoryPlot plot = chart.getCategoryPlot(); // 数据轴精度 NumberAxis vn = (NumberAxis) plot.getRangeAxis(); // 设置刻度必须从0开始 // vn.setAutoRangeIncludesZero(true); DecimalFormat df = new DecimalFormat("#0.00"); vn.setNumberFormatOverride(df); // 数据轴数据标签的显示格式 CategoryAxis domainAxis = plot.getDomainAxis(); domainAxis.setCategoryLabelPositions(CategoryLabelPositions.UP_45); // 横轴上的 domainAxis.setLabelFont(labelFont);// 轴标题 domainAxis.setTickLabelFont(labelFont);// 轴数值 domainAxis.setMaximumCategoryLabelWidthRatio(0.8f);// 横轴上的 Lable 是否完整显示 // domainAxis.setVerticalCategoryLabels(false); plot.setDomainAxis(domainAxis); ValueAxis rangeAxis = plot.getRangeAxis(); rangeAxis.setLabelFont(labelFont); rangeAxis.setTickLabelFont(labelFont); // 设置最高的一个 Item 与图片顶端的距离 rangeAxis.setUpperMargin(0.15); // 设置最低的一个 Item 与图片底端的距离 rangeAxis.setLowerMargin(0.15); plot.setRangeAxis(rangeAxis); BarRenderer renderer = new BarRenderer(); // 设置柱子宽度 renderer.setMaximumBarWidth(0.03); // 设置柱子高度 renderer.setMinimumBarLength(30); renderer.setBaseOutlinePaint(Color.BLACK); // 设置柱的颜色 renderer.setSeriesPaint(0, Color.GREEN); renderer.setSeriesPaint(1, new Color(0, 0, 255)); // 设置每个地区所包含的平行柱的之间距离 renderer.setItemMargin(0.5); // 显示每个柱的数值,并修改该数值的字体属性 renderer.setBaseItemLabelGenerator(new StandardCategoryItemLabelGenerator()); // 设置柱的数值可见 renderer.setBaseItemLabelsVisible(true); plot.setRenderer(renderer); // 设置柱的透明度 plot.setForegroundAlpha(0.6f); FileOutputStream fos_jpg = null; try { isChartPathExist(CHART_PATH); String chartName = CHART_PATH + charName; fos_jpg = new FileOutputStream(chartName); ChartUtilities.writeChartAsPNG(fos_jpg, chart, 500, 500, true, 10); return chartName; } catch (Exception e) { e.printStackTrace(); return null; } finally { try { fos_jpg.close(); } catch (Exception e) { e.printStackTrace(); } } } /** * * 饼状图 * * * * @param dataset * * 数据集 * * @param chartTitle * * 图标题 * * @param charName * * 生成图的名字 * * @param pieKeys * * 分饼的名字集 * * @return * */ public String createValidityComparePimChar(PieDataset dataset, String chartTitle, String charName, String[] pieKeys) { JFreeChart chart = ChartFactory.createPieChart3D(chartTitle, // chart // title dataset, // data true, // include legend true, false); // 使下说明标签字体清晰,去锯齿类似于 // chart.getRenderingHints().put(RenderingHints.KEY_TEXT_ANTIALIASING,RenderingHints.VALUE_TEXT_ANTIALIAS_OFF);的效果 chart.setTextAntiAlias(false); // 图片背景色 chart.setBackgroundPaint(Color.white); // 设置图标题的字体重新设置title Font font = new Font("隶书", Font.BOLD, 25); TextTitle title = new TextTitle(chartTitle); title.setFont(font); chart.setTitle(title); // 设置图表下方的图例说明字体 chart.getLegend().setItemFont(new Font("微软雅黑", Font.BOLD, 12)); PiePlot3D plot = (PiePlot3D) chart.getPlot(); // 图片中显示百分比:默认方式 // 指定饼图轮廓线的颜色 // plot.setBaseSectionOutlinePaint(Color.BLACK); // plot.setBaseSectionPaint(Color.BLACK); // 设置无数据时的信息 plot.setNoDataMessage("无对应的数据,请重新查询。"); // 设置无数据时的信息显示颜色 plot.setNoDataMessagePaint(Color.red); // 图片中显示百分比:自定义方式,{0} 表示选项, {1} 表示数值, {2} 表示所占比例 ,小数点后两位 plot.setLabelGenerator(new StandardPieSectionLabelGenerator( "{0}={1}({2})", NumberFormat.getNumberInstance(), new DecimalFormat("0.00%"))); // 图例显示百分比:自定义方式, {0} 表示选项, {1} 表示数值, {2} 表示所占比例 plot.setLegendLabelGenerator(new StandardPieSectionLabelGenerator( "{0}={1}({2})")); plot.setLabelFont(new Font("SansSerif", Font.TRUETYPE_FONT, 12)); // 指定图片的透明度(0.0-1.0) plot.setForegroundAlpha(0.65f); // 指定显示的饼图上圆形(false)还椭圆形(true) plot.setCircular(false, true); // 设置第一个 饼块section 的开始位置,默认是12点钟方向 plot.setStartAngle(90); // // 设置分饼颜色 plot.setSectionPaint(pieKeys[0], new Color(244, 194, 144)); plot.setSectionPaint(pieKeys[1], new Color(144, 233, 144)); FileOutputStream fos_jpg = null; try { // 文件夹不存在则创建 isChartPathExist(CHART_PATH); String chartName = CHART_PATH + charName; fos_jpg = new FileOutputStream(chartName); // 高宽的设置影响椭圆饼图的形状 ChartUtilities.writeChartAsPNG(fos_jpg, chart, 500, 230); return chartName; } catch (Exception e) { e.printStackTrace(); return null; } finally { try { fos_jpg.close(); System.out.println("create pie-chart."); } catch (Exception e) { e.printStackTrace(); } } } /** * * 判断文件夹是否存在,如果不存在则新建 * * * * @param chartPath * */ private void isChartPathExist(String chartPath) { File file = new File(chartPath); if (!file.exists()) { file.mkdirs(); // log.info("CHART_PATH="+CHART_PATH+"create."); } } /** * * 折线图 * * * * @param chartTitle * * @param x * * @param y * * @param xyDataset * * @param charName * * @return * */ public String createTimeXYChar(String chartTitle, String x, String y, CategoryDataset xyDataset, String charName) { JFreeChart chart = ChartFactory.createLineChart(chartTitle, x, y, xyDataset, PlotOrientation.VERTICAL, true, true, false); chart.setTextAntiAlias(false); chart.setBackgroundPaint(Color.WHITE); // 设置图标题的字体重新设置title Font font = new Font("隶书", Font.BOLD, 25); TextTitle title = new TextTitle(chartTitle); title.setFont(font); chart.setTitle(title); // 设置图表下方的图例说明字体 chart.getLegend().setItemFont(new Font("微软雅黑", Font.BOLD, 12)); // 设置面板字体 Font labelFont = new Font("SansSerif", Font.TRUETYPE_FONT, 12); chart.setBackgroundPaint(Color.WHITE); CategoryPlot categoryplot = (CategoryPlot) chart.getPlot(); // x轴 // 分类轴网格是否可见 categoryplot.setDomainGridlinesVisible(true); // y轴 //数据轴网格是否可见 categoryplot.setRangeGridlinesVisible(true); categoryplot.setRangeGridlinePaint(Color.WHITE);// 虚线色彩 categoryplot.setDomainGridlinePaint(Color.WHITE);// 虚线色彩 categoryplot.setBackgroundPaint(Color.lightGray); // 设置轴和面板之间的距离 // categoryplot.setAxisOffset(new RectangleInsets(5D, 5D, 5D, 5D)); CategoryAxis domainAxis = categoryplot.getDomainAxis(); domainAxis.setLabelFont(labelFont);// 轴标题 domainAxis.setTickLabelFont(labelFont);// 轴数值 domainAxis.setCategoryLabelPositions(CategoryLabelPositions.UP_45); // 横轴上的 // Lable // 45度倾斜 // 设置距离图片左端距离 domainAxis.setLowerMargin(0.0); // 设置距离图片右端距离 domainAxis.setUpperMargin(0.0); NumberAxis numberaxis = (NumberAxis) categoryplot.getRangeAxis(); numberaxis.setStandardTickUnits(NumberAxis.createIntegerTickUnits()); numberaxis.setAutoRangeIncludesZero(true); numberaxis.setLabelFont(labelFont); numberaxis.setTickLabelFont(labelFont); // 获得renderer 注意这里是下嗍造型到lineandshaperenderer!! LineAndShapeRenderer lineandshaperenderer = (LineAndShapeRenderer) categoryplot .getRenderer(); lineandshaperenderer.setBaseShapesVisible(true); // series 点(即数据点)可见 lineandshaperenderer.setBaseLinesVisible(true); // series 点(即数据点)间有连线可见 // 显示折点数据 // lineandshaperenderer.setBaseItemLabelGenerator(new // StandardCategoryItemLabelGenerator()); // lineandshaperenderer.setBaseItemLabelsVisible(true); FileOutputStream fos_jpg = null; try { isChartPathExist(CHART_PATH); String chartName = CHART_PATH + charName; fos_jpg = new FileOutputStream(chartName); // 将报表保存为png文件 ChartUtilities.writeChartAsPNG(fos_jpg, chart, 500, 510); return chartName; } catch (Exception e) { e.printStackTrace(); return null; } finally { try { fos_jpg.close(); System.out.println("create time-createTimeXYChar."); } catch (Exception e) { e.printStackTrace(); } } } /** * * 堆栈柱状图 * * * * @param dataset * * @param xName * * @param yName * * @param chartTitle * * @param charName * * @return * */ public String createStackedBarChart(CategoryDataset dataset, String xName, String yName, String chartTitle, String charName) { // 1:得到 CategoryDataset // 2:JFreeChart对象 JFreeChart chart = ChartFactory.createStackedBarChart(chartTitle, // 图表标题 xName, // 目录轴的显示标签 yName, // 数值轴的显示标签 dataset, // 数据集 PlotOrientation.VERTICAL, // 图表方向:水平、垂直 true, // 是否显示图例(对于简单的柱状图必须是false) false, // 是否生成工具 false // 是否生成URL链接 ); // 图例字体清晰 chart.setTextAntiAlias(true); chart.setBackgroundPaint(Color.WHITE); // 2 .2 主标题对象 主标题对象是 TextTitle 类型 chart.setTitle(new TextTitle(chartTitle, new Font("隶书", Font.BOLD, 25))); // 2 .2.1:设置中文 // x,y轴坐标字体 Font labelFont = new Font("SansSerif", Font.TRUETYPE_FONT, 12); // 设置图表下方的图例说明字体 chart.getLegend().setItemFont(new Font("微软雅黑", Font.BOLD, 12)); // 2 .3 Plot 对象 Plot 对象是图形的绘制结构对象 CategoryPlot plot = chart.getCategoryPlot(); // 设置横虚线可见 plot.setRangeGridlinesVisible(true); // 虚线色彩 plot.setRangeGridlinePaint(Color.gray); // 数据轴精度 NumberAxis vn = (NumberAxis) plot.getRangeAxis(); // 设置最大值是1 vn.setUpperBound(1); // 设置数据轴坐标从0开始 // vn.setAutoRangeIncludesZero(true); // 数据显示格式是百分比 DecimalFormat df = new DecimalFormat("0.00%"); vn.setNumberFormatOverride(df); // 数据轴数据标签的显示格式 // DomainAxis (区域轴,相当于 x 轴), RangeAxis (范围轴,相当于 y 轴) CategoryAxis domainAxis = plot.getDomainAxis(); domainAxis.setLabelFont(labelFont);// 轴标题 domainAxis.setTickLabelFont(labelFont);// 轴数值 // x轴坐标太长,建议设置倾斜,如下两种方式选其一,两种效果相同 // 倾斜(1)横轴上的 Lable 45度倾斜 // domainAxis.setCategoryLabelPositions(CategoryLabelPositions.UP_45); // 倾斜(2)Lable(Math.PI 3.0)度倾斜 // domainAxis.setCategoryLabelPositions(CategoryLabelPositions // .createUpRotationLabelPositions(Math.PI / 3.0)); domainAxis.setMaximumCategoryLabelWidthRatio(0.6f);// 横轴上的 Lable 是否完整显示 plot.setDomainAxis(domainAxis); // y轴设置 ValueAxis rangeAxis = plot.getRangeAxis(); rangeAxis.setLabelFont(labelFont); rangeAxis.setTickLabelFont(labelFont); // 设置最高的一个 Item 与图片顶端的距离 rangeAxis.setUpperMargin(0.15); // 设置最低的一个 Item 与图片底端的距离 rangeAxis.setLowerMargin(0.15); plot.setRangeAxis(rangeAxis); // Renderer 对象是图形的绘制单元 StackedBarRenderer renderer = new StackedBarRenderer(); renderer.setBaseItemLabelGenerator(new StandardCategoryItemLabelGenerator()); renderer.setBaseItemLabelsVisible(true);// 显示每个柱的数值 // 让柱子显示为一个平面图 // renderer.setBarPainter(new StandardBarPainter()); // 设置柱子宽度 renderer.setMaximumBarWidth(0.05); // 设置柱子高度 renderer.setMinimumBarLength(0.1); // 设置柱的边框颜色 renderer.setBaseOutlinePaint(Color.BLACK); // 设置柱的边框可见 renderer.setDrawBarOutline(true); // // 设置柱的颜色(可设定也可默认) renderer.setSeriesPaint(0, new Color(204, 255, 204)); renderer.setSeriesPaint(1, new Color(255, 204, 153)); // 设置每个地区所包含的平行柱的之间距离 renderer.setItemMargin(0.4); // 设置柱的透明度(如果是3D的必须设置才能达到立体效果,如果是2D的设置则使颜色变淡) plot.setForegroundAlpha(0.8f); plot.setRenderer(renderer); FileOutputStream fos_jpg = null; try { isChartPathExist(CHART_PATH); String chartName = CHART_PATH + charName; fos_jpg = new FileOutputStream(chartName); // 将报表保存为png文件 ChartUtilities.writeChartAsPNG(fos_jpg, chart, 500, 510); return chartName; } catch (Exception e) { e.printStackTrace(); return null; } finally { try { fos_jpg.close(); System.out.println("create time-createTimeXYChar."); } catch (Exception e) { e.printStackTrace(); } } // try { // // 文件名自动生成,生成好的图片会自动放在服务器的临时文件下(temp) // String filename = ServletUtilities.saveChartAsPNG(chart, 800, 400, // null, request.getSession()); // // // 根据文件名去临时目录下寻找该图片, // // 这里的/DisplayChart路径要与配置文件里用户自定义的一致 // String graphURL = request.getContextPath() // + "/displayChart?filename=" + filename; // return graphURL; // } catch (IOException e) { // // TODO Auto-generated catch block // e.printStackTrace(); // return null; // } } }