csdn的文件限制导致,gif图片不清晰,我把文章放到简书上了,地址:http://www.jianshu.com/p/2f3f6047d99a
什么时候开始接触teechart呢,说来话还真的很长,大约是2005年左右,那时候的资料都在大富翁论坛查询,虽然www.delphibbs.com已经不复存在了,但是我的生活还得继续,从Delphi程序员转到了VC++程序员,但是teechart这个控件从原生的VCL版本到了ActiveX版本。我的VC是从VC++6.0开始的,因为接手的老项目是VC++6.0开始的,一直固执的认为这个编译器已经够了,所以熟悉了上面的好多插件,如VAX,wndtabs,VC6LineNumberAddin等等,说偏题了。之所以升级到新的编译器是因为新的Visual studio调试起来更方便。回到正轨还是谈谈teechart这款插件的使用,步骤如下:
(1)系统注册:
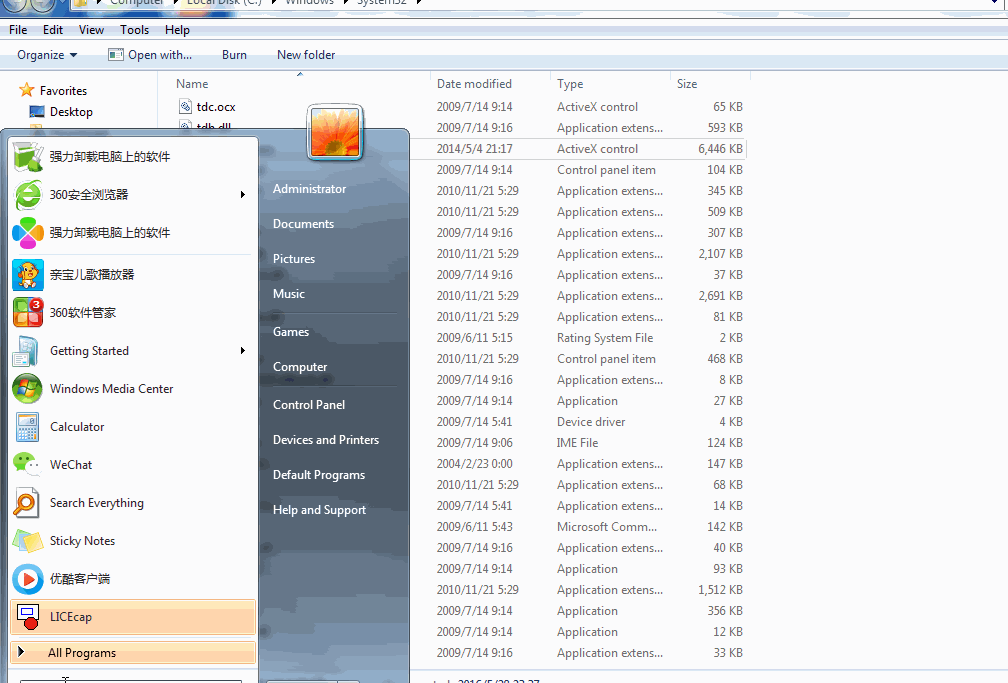
teechart8.ocx文件,这是Activex的文件,使用之前先注册一下,将该文件放入系统目录下,然后打开命令提示符,或者直接在运行窗口输入:regsvr32 TeeChart8.ocx,然后会有一个注册成功的提示框,说明我们的ActiveX控件注册成功,在VC6下就可以使用了。如果不想使用了,可以使用regsvr32 -u TeeChart8.ocx 解除对teechart8的注册。
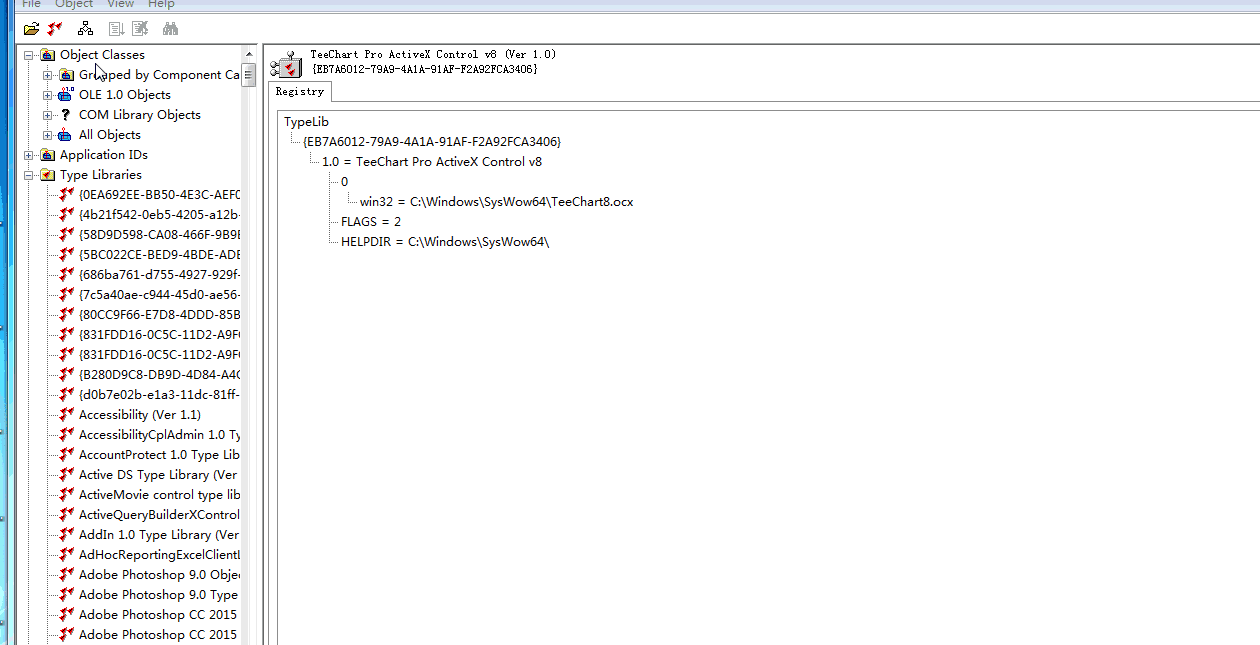
(2)接口查看(借助工具oleview.exe) ActiveX对象查看器
(3)VC6.0使用
方法1 :从菜单上 Project – Add To Project – Components and control–Registered ActiveX Controls–Insert
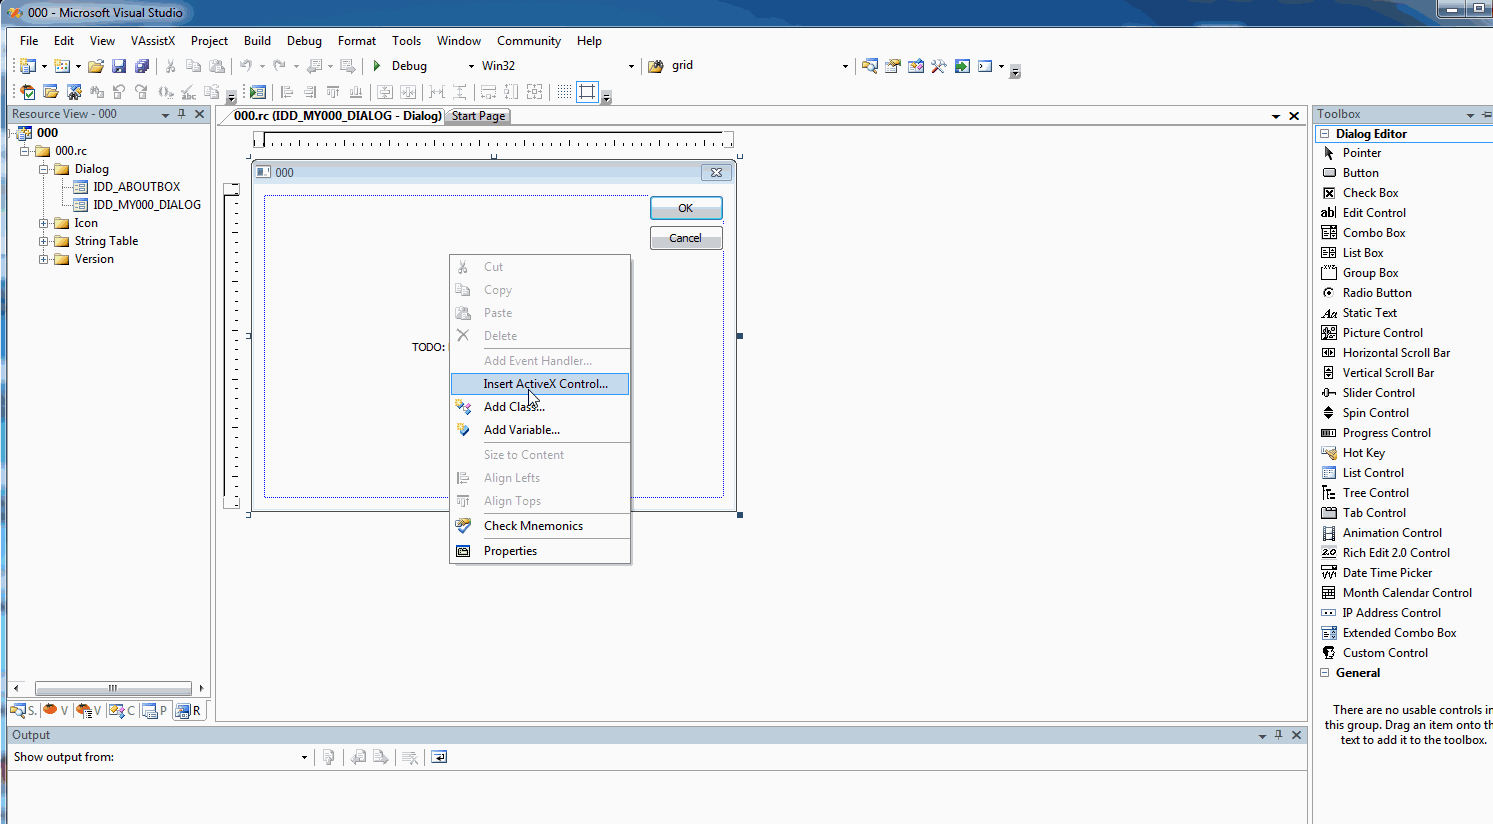
方法2 右击对话框–Insert ActiveX Control
–从弹出的Components and Controls Gallery 框中
选择TeeChart Pro Activex control v8,添加关联变量,如了解选择其中需要的类,否则全选即可
(4)Visual Studio 2010使用
VS2010 使用TeeChart绘图控件 - 之一 - 控件和类的导入
(5)程序开发
(VC 6.0)
// 142Dlg.cpp : implementation file
//

#include "stdafx.h"
#include "142.h"
#include "142Dlg.h"
#include "aspect.h"
#include "series.h"
#include "legend.h"

#ifdef _DEBUG
#define new DEBUG_NEW
#undef THIS_FILE
static char THIS_FILE[] = __FILE__;
#endif

void CMy142Dlg::OnButton1()
{
    // TODO: Add your control notification handler code here
    m_chart.ClearChart();
    m_chart.GetAspect().SetView3D(FALSE);
    m_chart.GetLegend().SetVisible(FALSE);
    int nseriesNo=m_chart.AddSeries(6);
    CSeries pSeris;
    pSeris=m_chart.Series(nseriesNo);
    pSeris.FillSampleValues(20);
}
(VS 2010)
// 142Dlg.cpp : implementation file
//

#include "stdafx.h"
#include "142.h"
#include "142Dlg.h"
#include "tchart1.h"
#include "CSeries.h"
#include "CAspect.h"
#include "CLegend.h"

#ifdef _DEBUG
#define new DEBUG_NEW
#endif

void CMy142Dlg::OnBnClickedButton1()
{
    // TODO: Add your control notification handler code here
    m_chart.ClearChart();
    ((CAspect) m_chart.get_Aspect()).put_View3D(FALSE);
    ((CLegend)m_chart.get_Legend()).put_Visible(FALSE);
    int nseriesNo=m_chart.AddSeries(CTchart1::scFastLine);
    CSeries pSeris;
    pSeris=m_chart.Series(nseriesNo);
    pSeris.FillSampleValues(20);

}
(6)在VC++6.0和Visual Studio各大版本上的使用总结:通过oleview.exe软件的typelib接口查看,得知接口一致,因为不同的编译软件,产生的头文件和接口有区别,导致给开发人员的友好程度不一样,我们还是喜欢VC++6.0的风格。其他版本上可以直接引用通过VC++6.0导出的头文件即可。
附:
有关teechart的使用问题,还是得多看官方说明书,会解决很多的疑问,
ITChart.AddSeries
ITChart
---
function AddSeries(SeriesClass: ESeriesClass): Integer;

Type Library
TeeChartx

Description
The AddSeries method adds a new Series class to the Chart.

Example [Visual Basic]:

TChart1.AddSeries(scLine)

---
ESeriesClass
type ESeriesClass = (scLine, scBar, scHorizBar, scArea, scPoint, scPie, scFastLine, scShape, scGantt, scBubble, scArrow, scCandle, scPolar, scSurface, scVolume, scErrorBar, scBezier, scContour, scError, scPoint3D, scRadar, scClock, scWindRose, scBar3D, scImageBar, scDonut, scTriSurface, scBox, scHorizBox, scHistogram, scColorGrid, scBarJoin, scHighLow, scWaterfall, scSmith, scPyramid, scMap, scHorizLine, scFunnel, scCalendar, scHorizArea, scPointFigure, scGauge, scVector3D, scTower, scPolarBar, scBubble3D, scHorizHistogram, scVolumePipe, scIsoSurface, scDarvas, scHighLowLine, scPolarGrid, scDeltaPoint, scImagePoint, scOrganizational, scWorld, scTagCloud, scKagi, scRenko, scNumericGauge, scLinearGauge, scCircularGauge, scBigCandle, scLinePoint);

Type Library
TeeChartx

Description
ESeriesClass is used when adding new Series to a TChart. See TChart.AddSeries.

See note on use of Enum constants in differing development environments.

Values are

scLine = 0;
scBar = 1;
scHorizBar = 2;
scArea = 3;
scPoint = 4;
scPie = 5;
scFastLine = 6;
scShape = 7;
scGantt = 8;
scBubble = 9;
scArrow = 10;
scCandle = 11;
scPolar = 12;
scSurface = 13;
scVolume = 14;
scErrorBar = 15;
scBezier = 16;
scContour = 17;
scError = 18;
scPoint3D = 19;
scRadar = 20;
scClock = 21;
scWindRose = 22;
scBar3D = 23;
scImageBar = 24;
scDonut = 25;

scTriSurface = 26;
scBox = 27;
scHorizBox = 28;
scHistogram = 29;
scColorGrid = 30;
scBarJoin = 31;
scHighLow = 32;
scWaterfall = 33;
scSmith = 34;
scPyramid = 35;
scMap = 36;
scHorizLine = 37;
scFunnel = 38;
scCalendar = 39;
scHorizArea = 40;
scPointFigure = 41;
scGauge = 42;
scVector3D = 43;
scTower = 44;
scPolarBar = 45;
scBubble3D = 46;
scHorizHistogram = 47;
scVolumePipe = 48;
scIsoSurface = 49;
scDarvas = 50;
scHighLowLine = 51;
scPolarGrid = 52;

scDeltaPoint = 53;
scImagePoint = 54;
scOrganizational = 55;
scWorld = 56;
scTagCloud = 57;
scKagi = 58;
scRenko = 59;
scNumericGauge = 60;
scLinearGauge = 61;
scCircularGauge = 62;
scBigCandle  = 63;
scLinePoint = 64;