我们都知道,在 MaxCompute Console 里,可以使用下面的命令来列出运行完成的 instance 列表。
show p|proc|processlist [from <yyyy-MM-dd>] [to <yyyy-MM-dd>] [-p <project>] [-limit <number> | <number>] [-all]
ls|list instances [from <yyyy-MM-dd>] [to <yyyy-MM-dd>] [-p <project>] [-limit <number> | <number>] [-all]
但很多时候,我们希望可以找出当前**正在运行的 instance** 。MaxCompute Console 新增了 top instance 命令来实现这个功能。(注意: MaxCompute Console 版本要 >= 0.28.0)
一个最简单的例子。
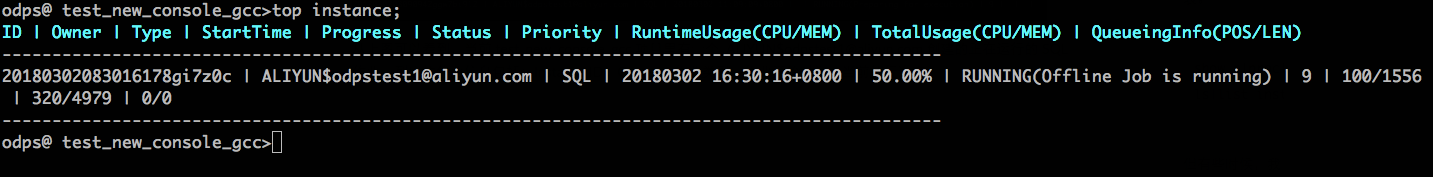
从上图可以看到,当前 test_new_console_gcc 项目里有一个正在运行的 SQL 作业。
列出的作业信息包括:Instance ID、Owner、作业类型、作业开始时间、当前执行进度百分比、作业状态和详细进度、作业优先级、当前所占资源和作业总共使用的资源情况、作业排队的情况。
列出的作业信息包括:Instance ID、Owner、作业类型、作业开始时间、当前执行进度百分比、作业状态和详细进度、作业优先级、当前所占资源和作业总共使用的资源情况、作业排队的情况。
下面我们通过
help top; 命令来查看下这个命令的使用说明。
Usage: top instance [options];
       -p <project>                  specify the project
       -status <running|suspended>   specify the instance status
       -limit <number>               specify the maximum number of queueing instance to show, default 50
       -d [<delay>]                  auto refresh every <delay> seconds, default 3
       -all                          list all instances, not only yours
其中:
-p 参数用于指定 project,默认是当前project;
-status 参数用来对 instance status 做过滤,默认不做过滤;
-limit 参数指定显示的最大条数,默认为 50;
-d 参数用于打开自动刷新显示模式,并可以指定自动刷新的间隔,默认是 3秒, 可以使用
ctrl-c退出该模式;
-all 参数表示列出 project 里所有正运行中 instance,包括其他用户的作业。
很多时候,我们的一个复杂 sql 需要跑很久,不可能一直守在电脑面前盯着。当我们回过头想再追踪这个作业时,就可以先使用
top instance 命令找到运行中的 instance,然后再运行
wait <instance_id> 命令来重新跟踪这个作业了。
很多时候,我们发现作业跑的很慢,是不是资源被占满了呢?我的作业排在第几位呢?当前有哪些作业在跑并且占了多少资源?这时,可以通过
top intance -all 命令来找到罪魁祸首 Instance,联系其 ProjectOwner 进行调整。 方法:Kill Instance
命令格式如下: