版权声明:本文为博主原创文章,未经博主允许不得转载。 https://blog.csdn.net/brucewong0516/article/details/84768464
首先我们直接看官方的文档:
DataFrame.resample(rule, how=None, axis=0, fill_method=None, closed=None,
				    label=None, convention='start', kind=None, loffset=None,
				    limit=None, base=0, on=None, level=None)
- 聚合的时间参数rule
- 参数如下:
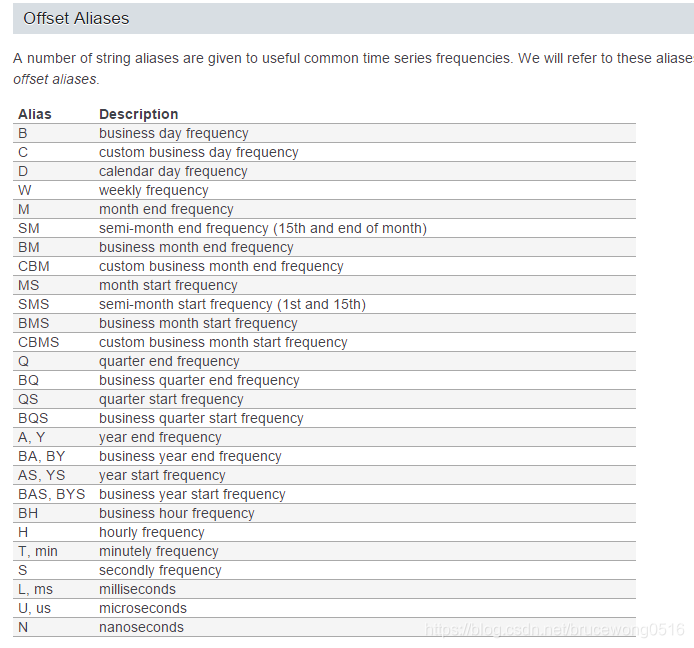
rule : 表示目标转换的偏移字符串或对象,一般是时间参数,比如“M”,“A”,“Q”,“BM”,“BA”,“BQ”和“W”;
axis : int, optional, default 0
closed : {‘right’, ‘left’};间隔的哪一侧是关闭的,对于除“M”,“A”,“Q”,“BM”,“BA”,“BQ”和“W”之外的所有频率偏移,默认值为“左”,其默认值均为“右”
label : {‘right’, ‘left’};用于标记bins,间隔的哪一侧是关闭的,对于除“M”,“A”,“Q”,“BM”,“BA”,“BQ”和“W”之外的所有频率偏移,默认值为“左”,其默认值均为“右”
convention : {‘start’, ‘end’, ‘s’, ‘e’}:For PeriodIndex only, controls whether to use the start or end of rule
kind: {‘timestamp’, ‘period’}, optional;Pass ‘timestamp’ to convert the resulting index to a DateTimeIndex or ‘period’ to convert it to a PeriodIndex. By default the input representation is retained.
loffset : 调整重新采样的时间标签
on : 对于DataFrame,要使用的列而不是索引进行重新采样。列必须与日期时间相似的数据。
实例
1.1 创建时间索引,并查看按时间合并后进行求和计算
#首先创建一个包含9个一分钟时间戳的系列
index = pd.date_range('1/1/2000', periods=9, freq='T')  # 生成频率为每分钟的数据
series = pd.Series(range(9), index=index)

series
Out[31]:
2000-01-01 00:00:00    0
2000-01-01 00:01:00    1
2000-01-01 00:02:00    2
2000-01-01 00:03:00    3
2000-01-01 00:04:00    4
2000-01-01 00:05:00    5
2000-01-01 00:06:00    6
2000-01-01 00:07:00    7
2000-01-01 00:08:00    8
Freq: T, dtype: int64

series.resample('3T')
# 3T就是rule,合并的方向默认是axis = 0;
Out[34]: DatetimeIndexResampler [freq=<3 * Minutes>, axis=0, closed=left, label=left, convention=start, base=0]

series.resample('3T').sum()
Out[35]:
2000-01-01 00:00:00     3
2000-01-01 00:03:00    12
2000-01-01 00:06:00    21
Freq: 3T, dtype: int64
1.2 close和left的左右
# 间隔的哪一侧是关闭的,对于除“M”,“A”,“Q”,“BM”,“BA”,“BQ”和“W”之外的所有频率偏移,默认值为“左”,其默认值均为“右”

series.resample('W')
Out[37]: DatetimeIndexResampler [freq=<Week: weekday=6>, axis=0, closed=right, label=right, convention=start, base=0]
series.resample('T')
Out[38]: DatetimeIndexResampler [freq=<Minute>, axis=0, closed=left, label=left, convention=start, base=0]

# 如果是T分钟频率,合并后的K线是从合并的时间开始计算,如果是2T,就从开始的第一根往后数2根;
series.resample('T').sum()
Out[40]:
2000-01-01 00:00:00    0
2000-01-01 00:01:00    1
2000-01-01 00:02:00    2
2000-01-01 00:03:00    3
2000-01-01 00:04:00    4
2000-01-01 00:05:00    5
2000-01-01 00:06:00    6
2000-01-01 00:07:00    7
2000-01-01 00:08:00    8
Freq: T, dtype: int64

# 对比可以看出是左侧关闭的
series.resample('2T').sum()
Out[42]:
2000-01-01 00:00:00     1
2000-01-01 00:02:00     5
2000-01-01 00:04:00     9
2000-01-01 00:06:00    13
2000-01-01 00:08:00     8
Freq: 2T, dtype: int64

# 如果是W周频率,那么整个合并的结果归集到最后一天
series = pd.Series(range(9), index=index)
series.resample('W').sum()
Out[53]:
2000-01-02     0
2000-01-09     3
2000-01-16    12
2000-01-23    13
2000-01-30     8
Freq: W-SUN, dtype: int64

series
Out[54]:
2000-01-01    0
2000-01-04    1
2000-01-07    2
2000-01-10    3
2000-01-13    4
2000-01-16    5
2000-01-19    6
2000-01-22    7
2000-01-25    8
Freq: 3D, dtype: int64
1.3 自定义label的方向,也就是数据归集的位置
index = pd.date_range('1/1/2000', periods=9, freq='T')  # 生成频率为每分钟的数据
series = pd.Series(range(9), index=index)
series.resample('3T', label='right').sum()

Out[57]:
2000-01-01 00:03:00     3
2000-01-01 00:06:00    12
2000-01-01 00:09:00    21
Freq: 3T, dtype: int64
1.4 自定义close的方向
index = pd.date_range('1/1/2000', periods=9, freq='T')  # 生成频率为每分钟的数据
series = pd.Series(range(9), index=index)


series
Out[63]:
2000-01-01 00:00:00    0
2000-01-01 00:01:00    1
2000-01-01 00:02:00    2
2000-01-01 00:03:00    3
2000-01-01 00:04:00    4
2000-01-01 00:05:00    5
2000-01-01 00:06:00    6
2000-01-01 00:07:00    7
2000-01-01 00:08:00    8
Freq: T, dtype: int64
# 被合并的数据的最右不显示,关闭箱间隔的右侧
series.resample('3T', closed='right').sum()
Out[64]:
1999-12-31 23:57:00     0
2000-01-01 00:00:00     6
2000-01-01 00:03:00    15
2000-01-01 00:06:00    15
Freq: 3T, dtype: int64
1.5 上采用成30s的数据,加上asfreq()
series.resample('30S').asfreq()
Out[66]:
2000-01-01 00:00:00    0.0
2000-01-01 00:00:30    NaN
2000-01-01 00:01:00    1.0
2000-01-01 00:01:30    NaN
2000-01-01 00:02:00    2.0
2000-01-01 00:02:30    NaN
2000-01-01 00:03:00    3.0
2000-01-01 00:03:30    NaN
2000-01-01 00:04:00    4.0
2000-01-01 00:04:30    NaN
2000-01-01 00:05:00    5.0
2000-01-01 00:05:30    NaN
2000-01-01 00:06:00    6.0
2000-01-01 00:06:30    NaN
2000-01-01 00:07:00    7.0
2000-01-01 00:07:30    NaN
2000-01-01 00:08:00    8.0
Freq: 30S, dtype: float64
1.6 将系列上采样到30秒的箱中,并使用pad方法填充NaN值
series.resample('30S').pad()[0:5]
Out[67]:
2000-01-01 00:00:00    0
2000-01-01 00:00:30    0
2000-01-01 00:01:00    1
2000-01-01 00:01:30    1
2000-01-01 00:02:00    2
Freq: 30S, dtype: int64
1.7 将系列上上采样30秒的箱中,并使用bfill方法填充NaN值
series.resample('30S').bfill()[0:5]
Out[68]:
2000-01-01 00:00:00    0
2000-01-01 00:00:30    1
2000-01-01 00:01:00    1
2000-01-01 00:01:30    2
2000-01-01 00:02:00    2
Freq: 30S, dtype: int64
1.8 通过apply传递自定义功能
def custom_resampler(array_like):
    return np.sum(array_like)+5


import numpy as np

series.resample('3T').apply(custom_resampler)
Out[74]:
2000-01-01 00:00:00     8
2000-01-01 00:03:00    17
2000-01-01 00:06:00    26
Freq: 3T, dtype: int64
1.9 对于具有PeriodIndex的Series,关键字约定可用于控制是否使用规则的开头或结尾。
s = pd.Series([1, 2], index=pd.period_range('2012-01-01',
                                                freq='A',
                                                periods=2))

# 上采样需要asfreq( )
s.resample('M', convention='start').asfreq().head()
Out[76]:
2012-01    1.0
2012-02    NaN
2012-03    NaN
2012-04    NaN
2012-05    NaN
Freq: M, dtype: float64

s.resample('M', convention='end').asfreq()
Out[78]:
2012-12    1.0
2013-01    NaN
2013-02    NaN
2013-03    NaN
2013-04    NaN
2013-05    NaN
2013-06    NaN
2013-07    NaN
2013-08    NaN
2013-09    NaN
2013-10    NaN
2013-11    NaN
2013-12    2.0
Freq: M, dtype: float64
1.10 对于DataFrame对象,关键字on可用于指定列而不是重新取样的索引
df = pd.DataFrame(data=9*[range(4)], columns=['a', 'b', 'c', 'd'])
df['time'] = pd.date_range('1/1/2000', periods=9, freq='T')
df.resample('3T', on='time').sum()

Out[81]:
                     a  b  c  d
time
2000-01-01 00:00:00  0  3  6  9
2000-01-01 00:03:00  0  3  6  9
2000-01-01 00:06:00  0  3  6  9
1.11 how,未来不会用的功能
index = pd.date_range('1/1/2000', periods=9, freq='T')  # 生成频率为每分钟的数据
series = pd.Series(range(9), index=index)


series.resample('2T',how='last')
Out[83]:
2000-01-01 00:00:00    1
2000-01-01 00:02:00    3
2000-01-01 00:04:00    5
2000-01-01 00:06:00    7
2000-01-01 00:08:00    8
Freq: 2T, dtype: int64

series.resample('2T',how='mean')
Out[84]:
2000-01-01 00:00:00    0.5
2000-01-01 00:02:00    2.5
2000-01-01 00:04:00    4.5
2000-01-01 00:06:00    6.5
2000-01-01 00:08:00    8.0
Freq: 2T, dtype: float64