在我们目标检测的研究中,为了体现模型各方面的性能,我们会有以下几个指标进行衡量。
1.precision-recall
在训练YOLO v2的过程中,系统会显示出一些评价训练效果的值,如Recall,IoU等等。为了怕以后忘了,现在把自己对这几种度量方式的理解记录一下。
这一文章首先假设一个测试集,然后围绕这一测试集来介绍这几种度量方式的计算方法。
大雁与飞机
假设现在有这样一个测试集,测试集中的图片只由大雁和飞机两种图片组成,如下图所示:
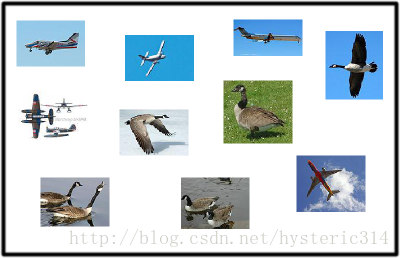
假设你的分类系统最终的目的是:能取出测试集中所有飞机的图片,而不是大雁的图片。
现在做如下的定义:
True positives : 飞机的图片被正确的识别成了飞机。
True negatives: 大雁的图片没有被识别出来,系统正确地认为它们是大雁。
False positives: 大雁的图片被错误地识别成了飞机。
False negatives: 飞机的图片没有被识别出来,系统错误地认为它们是大雁。
假设你的分类系统使用了上述假设识别出了四个结果,如下图所示:
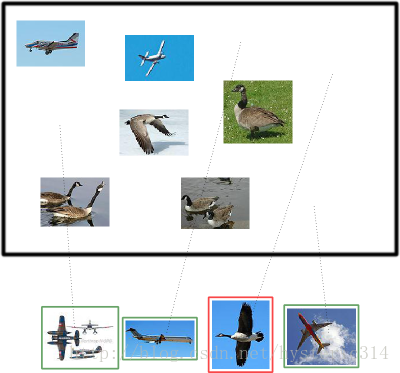
那么在识别出的这四张照片中:
True positives : 有三个,画绿色框的飞机。
False positives: 有一个,画红色框的大雁。
没被识别出来的六张图片中:
True negatives : 有四个,这四个大雁的图片,系统正确地没有把它们识别成飞机。
False negatives: 有两个,两个飞机没有被识别出来,系统错误地认为它们是大雁。
Precision 与 Recall
Precision其实就是在识别出来的图片中,True positives所占的比率: 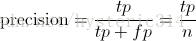
其中的n代表的是(True positives + False positives),也就是系统一共识别出来多少照片 。
在这一例子中,True positives为3,False positives为1,所以Precision值是 3/(3+1)=0.75。
意味着在识别出的结果中,飞机的图片占75%。
Recall 是被正确识别出来的飞机个数与测试集中所有飞机的个数的比值: 
Recall的分母是(True positives + False negatives),这两个值的和,可以理解为一共有多少张飞机的照片。
在这一例子中,True positives为3,False negatives为2,那么Recall值是 3/(3+2)=0.6。
意味着在所有的飞机图片中,60%的飞机被正确的识别成飞机.。
调整阈值
你也可以通过调整阈值,来选择让系统识别出多少图片,进而改变Precision 或 Recall 的值。
在某种阈值的前提下(蓝色虚线),系统识别出了四张图片,如下图中所示: 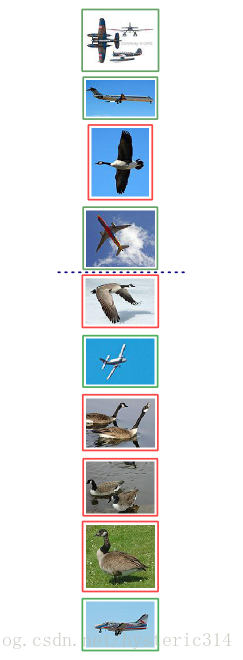
分类系统认为大于阈值(蓝色虚线之上)的四个图片更像飞机。
我们可以通过改变阈值(也可以看作上下移动蓝色的虚线),来选择让系统识别能出多少个图片,当然阈值的变化会导致Precision与Recall值发生变化。比如,把蓝色虚线放到第一张图片下面,也就是说让系统只识别出最上面的那张飞机图片,那么Precision的值就是100%,而Recall的值则是20%。如果把蓝色虚线放到第二张图片下面,也就是说让系统只识别出最上面的前两张图片,那么Precision的值还是100%,而Recall的值则增长到是40%。
那么如何去自动化实现呢?
第一步:修改pascal_voc.py文件
文档开始添加
import matplotlib.pyplot as plt
import pylab as pl
from sklearn.metrics import precision_recall_curve
from itertools import cycle
修改_do_python_eval函数:
    def _do_python_eval(self, output_dir = 'output'):
        annopath = os.path.join(
            self._devkit_path,
            'VOC' + self._year,
            'Annotations',
            '{:s}.xml')
        imagesetfile = os.path.join(
            self._devkit_path,
            'VOC' + self._year,
            'ImageSets',
            'Main',
            self._image_set + '.txt')
        cachedir = os.path.join(self._devkit_path, 'annotations_cache')
        aps = []
        # The PASCAL VOC metric changed in 2010
        use_07_metric = True if int(self._year) < 2010 else False
        print 'VOC07 metric? ' + ('Yes' if use_07_metric else 'No')
        if not os.path.isdir(output_dir):
            os.mkdir(output_dir)
        for i, cls in enumerate(self._classes):
            if cls == '__background__':
                continue
            filename = self._get_voc_results_file_template().format(cls)
            rec, prec, ap = voc_eval(
                filename, annopath, imagesetfile, cls, cachedir, ovthresh=0.5,
                use_07_metric=use_07_metric)
            aps += [ap]
            pl.plot(rec, prec, lw=2,
                    label='Precision-recall curve of class {} (area = {:.4f})'
                          ''.format(cls, ap))
            print('AP for {} = {:.4f}'.format(cls, ap))
            with open(os.path.join(output_dir, cls + '_pr.pkl'), 'w') as f:
                cPickle.dump({'rec': rec, 'prec': prec, 'ap': ap}, f)

        pl.xlabel('Recall')
        pl.ylabel('Precision')
        plt.grid(True)
        pl.ylim([0.0, 1.05])
        pl.xlim([0.0, 1.0])
        pl.title('Precision-Recall')
        pl.legend(loc="upper right")
        plt.show()

        print('Mean AP = {:.4f}'.format(np.mean(aps)))
        print('~~~~~~~~')
        print('Results:')
        for ap in aps:
            print('{:.3f}'.format(ap))
        print('{:.3f}'.format(np.mean(aps)))
        print('~~~~~~~~')
        print('')
        print('--------------------------------------------------------------')
        print('Results computed with the **unofficial** Python eval code.')
        print('Results should be very close to the official MATLAB eval code.')
        print('Recompute with `./tools/reval.py --matlab ...` for your paper.')
        print('-- Thanks, The Management')
        print('--------------------------------------------------------------')
第二步 执行test_net.py文件
解释:这段代码不是根据日志信息输出的,而是在测试过程中输出的
当你之前已经训练好模型,那么需要重新执行一下测试命令已输出曲线,命令如下:
./tools/test_net.py --gpu 0 --def models/pascal_voc/VGG16/faster_rcnn_end2end/test.prototxt --net output/faster_rcnn_end2end/voc_2007_trainval/vgg16_faster_rcnn_iter_70000.caffemodel --cfg experiments/cfgs/faster_rcnn_end2end.yml
2.IOU
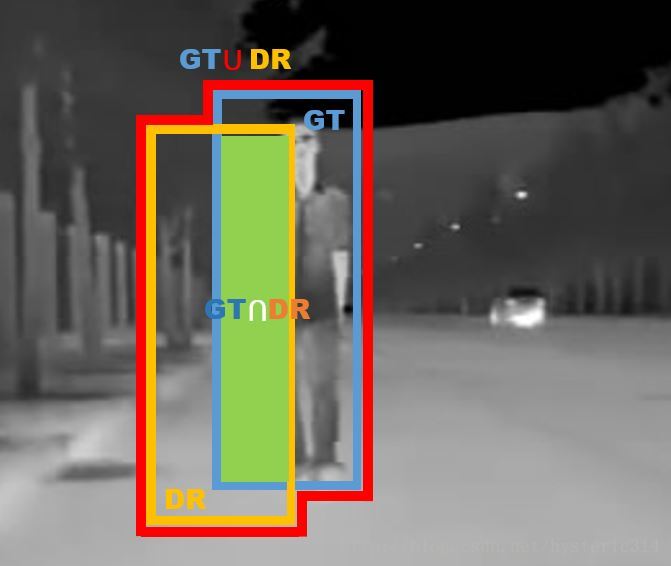
IoU这一值,可以理解为系统预测出来的框与原来图片中标记的框的重合程度。
计算方法即检测结果Detection Result与 Ground Truth 的交集比上它们的并集,即为检测的准确率:
如下图所示:
蓝色的框是:GroundTruth
黄色的框是:DetectionResult
绿色的框是:DetectionResult ⋂ GroundTruth
红色的框是:DetectionResult ⋃ GroundTruth