水球图是一种适合于展现单个百分比数据的图表类型
第一步:引入 JavaScript 文件
ECharts 的水球图是一个插件类型的图表。这意味着,在 ECharts 官网下载的完整版本将不包含水球图——这保证了不需要使用该图表的用户能够获得一个尽可能小的代码版本。使用时,需要在引入 echarts.js 之后,另外引入水球图对应的 echarts-liquidfill.js,可以在 GitHub 找到最新版本。
<script src="echarts.js"></script>
<script src="echarts-liquidfill.js"></script>

<script>
// 使用水球图的代码
</script>
第二步:指定 DOM 元素作为图表容器
和创建 ECharts 的其他图表一样,我们需要指定 DOM 中的一个有高度和宽度的元素作为图表的容器——也就是图表将会绘制的位置。
传入该 DOM 元素,使用 ECharts 初始化图表:
var chart = echarts.init(document.getElementById(‘main’));
第三步:设置水球图参数
和其他 ECharts 图表一样,水球图提供将系列的 type 指定为 ‘liquidFill‘(注意大小写)来表明这是一个水球图类型。
一个简单的配置项可以是:
var option = {
    series: [{
        type: 'liquidFill',
        data: [0.6, 0.5, 0.4, 0.3]
    }]
};
chart.setOption(option);
简单完整代码:
<!DOCTYPE html>
<html lang="en">
<head>
<meta charset="UTF-8">
<title>Title</title>
<script src="https://cdnjs.cloudflare.com/ajax/libs/echarts/3.4.0/echarts.min.js"></script>
<script src="http://echarts.baidu.com/resource/echarts-liquidfill-1.0.4/dist/echarts-liquidfill.js"></script>
</head>
<body>
<div id="main" style="width: 600px;height:400px;"></div>
<script>
var myChart = echarts.init(document.getElementById('main'));
var option = {
series: [{
type: 'liquidFill',
data: [0.6, 0.5, 0.4, 0.3]
}]
};
// 使用刚指定的配置项和数据显示图表。
myChart.setOption(option);
</script>
</body>
</html>实际项目中 如果发现图表没有正确显示,你可以检查以下几种可能:
JS 文件是否正确加载;
echarts 变量是否存在;
控制台是否报错(如果报错显示 liquidFill 系列不存在,则很可能 echarts-liquidfill.js 没有正确加载);
DOM 元素在 echarts.init 的时候是否有高度和宽度。
可以发现,在上面的代码中,我们只指定了图表类型为 ‘liquidFill’,以及把数据设置为 [0.7, 0.6, 0.5, 0.4](对应生成的四个波浪),而其他的参数都是预设的。
即使不配置很多参数,预设的参数也可以使你获得一个优雅的水球图效果。而如果有特定的需求,ECharts 水球图又支持非常高度定制的效果。下面我们具体说明如何定制化你的水球图。
这样,就能得到文章开头的水球图效果了:

第四步:定制化水球图
水球图支持非常高度定制化的需求,包括颜色(color)、大小(radius)、波的振幅(amplitude)、波长(waveLength)、相位(phase)、周期(period)、移动方向(direction)、形状(shape)、动画(waveAnimation)等等,完整的配置项参数参见水球图 API。文档有针对每个配置项的详细说明,这里我们来介绍一些重要的参数。
形状与动画
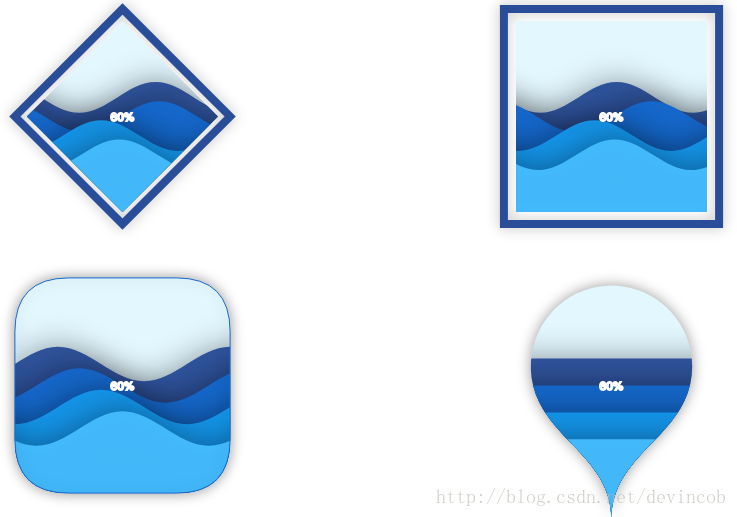
除了默认的圆形(’circle’)水球图,还可以将 shape 设置为 ECharts Symbol 的其他类型:’rect’、’roundRect’、’triangle’、’diamond’、’pin’、’arrow’。甚至,使用 ‘path://…’ 的形式,为其指定一个 SVG 路径,得到非常酷炫的效果:
通过将 direction 设为 ‘left’ 或 ‘right’,指定波浪的移动方向,或者设为 ‘none’ 表示静止。
上面的例子完整的配置项代码为:
<!DOCTYPE html>
<html lang="en">
<head>
    <meta charset="UTF-8">
    <title>Title</title>
    <script src="https://cdnjs.cloudflare.com/ajax/libs/echarts/3.4.0/echarts.min.js"></script>
    <script src="http://echarts.baidu.com/resource/echarts-liquidfill-1.0.4/dist/echarts-liquidfill.js"></script>
</head>
<body>
<div id="main" style="width: 900px;height:800px;"></div>
<script>
    var myChart = echarts.init(document.getElementById('main'));

    var option = {
        series: [{
            type: 'liquidFill',
            data: [0.6, 0.5, 0.4, 0.3],
            radius: '40%',
            shape: 'diamond',
            center: ['20%', '20%']
        }, {
            type: 'liquidFill',
            data: [0.6, 0.5, 0.4, 0.3],
            direction: 'right',
            radius: '40%',
            shape: 'rect',
            center: ['80%', '25%']
        }, {
            type: 'liquidFill',
            data: [0.6, 0.5, 0.4, 0.3],
            radius: '40%',
            shape: 'roundRect',
            center: ['20%', '80%'],
            backgroundStyle: {
                borderColor: '#156ACF',
                borderWidth: 1,
                shadowColor: 'rgba(0, 0, 0, 0.4)',
                shadowBlur: 20
            },
            outline: {
                show: false
            },
            waveAnimation: false, // 禁止左右波动
        }, {
            type: 'liquidFill',
            data: [0.6, 0.5, 0.4, 0.3],
            radius: '50%',
            shape: 'pin',
            center: ['80%', '75%'],
            amplitude: 0,
            waveAnimation: false,
            outline: {
                show: false
            },
            backgroundStyle: {
                shadowColor: 'rgba(0, 0, 0, 0.4)',
                shadowBlur: 20
            }
        },{
            type: 'liquidFill',
            data: [0.6, 0.5, 0.4, 0.3],
//            radius: '90%',
            outline: {
                show: false
            },
            backgroundStyle: {
                borderColor: '#156ACF',
                borderWidth: 1,
                shadowColor: 'rgba(0, 0, 0, 0.4)',
                shadowBlur: 20
            },
            shape: 'path://M367.855,428.202c-3.674-1.385-7.452-1.966-11.146-1.794c0.659-2.922,0.844-5.85,0.58-8.719 c-0.937-10.407-7.663-19.864-18.063-23.834c-10.697-4.043-22.298-1.168-29.902,6.403c3.015,0.026,6.074,0.594,9.035,1.728 c13.626,5.151,20.465,20.379,15.32,34.004c-1.905,5.02-5.177,9.115-9.22,12.05c-6.951,4.992-16.19,6.536-24.777,3.271 c-13.625-5.137-20.471-20.371-15.32-34.004c0.673-1.768,1.523-3.423,2.526-4.992h-0.014c0,0,0,0,0,0.014 c4.386-6.853,8.145-14.279,11.146-22.187c23.294-61.505-7.689-130.278-69.215-153.579c-61.532-23.293-130.279,7.69-153.579,69.202 c-6.371,16.785-8.679,34.097-7.426,50.901c0.026,0.554,0.079,1.121,0.132,1.688c4.973,57.107,41.767,109.148,98.945,130.793 c58.162,22.008,121.303,6.529,162.839-34.465c7.103-6.893,17.826-9.444,27.679-5.719c11.858,4.491,18.565,16.6,16.719,28.643 c4.438-3.126,8.033-7.564,10.117-13.045C389.751,449.992,382.411,433.709,367.855,428.202z',
            label: {
                normal: {
                    position: ['40%', '40%'],
                    formatter: function() {
                        return 'ECharts\nLiquid Fill';
                    },
                    textStyle: {
                        fontSize: 40,
                        color: '#D94854'
                    }
                }
            }
        }]
    };
    // 使用刚指定的配置项和数据显示图表。
    myChart.setOption(option);
</script>
</body>
</html>
单个波的配置
除了对所有水波做的设置之外,每个水波可以进行单独的配置。和 ECharts 的其他配置项一样,对单个数据的配置项将覆盖整个系列的配置项。
我们将第二条水波设为改变红色,改变波浪状态
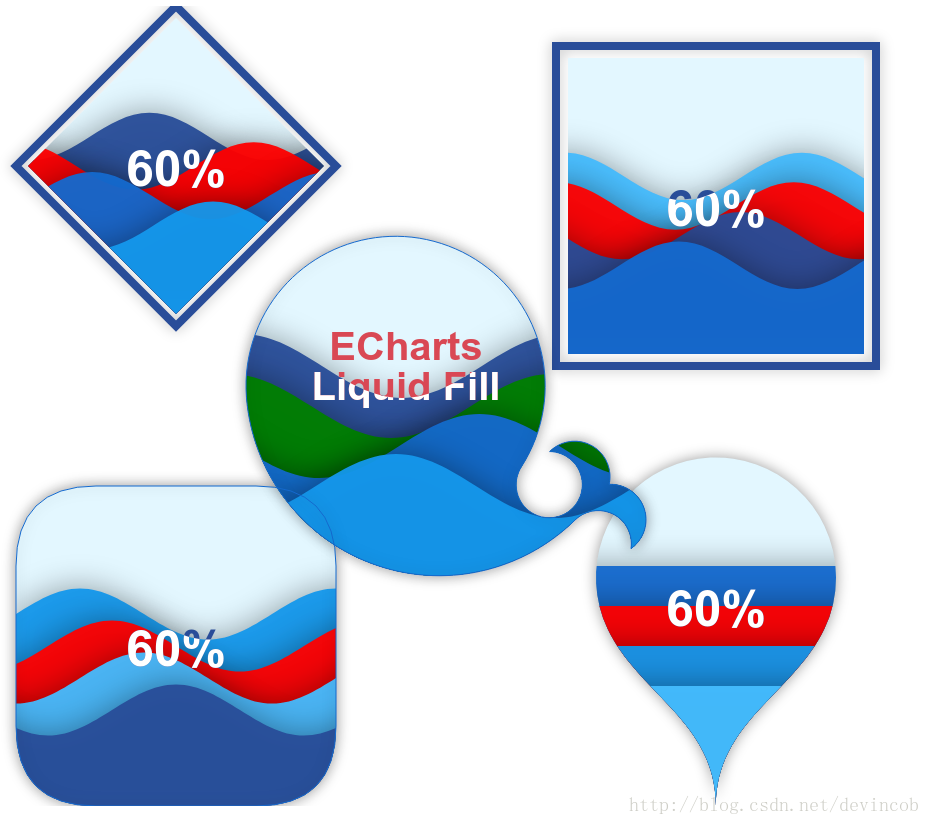
可以发现,原先 data 中的一项是一个数字,而在需要做特殊定制的数据中,我们将其设置为一个对象,value 值是原先的数字,其他配置项将覆盖系列配置项的值。
文字显示
水球图中间的文字有个酷炫的效果,在水波和背景前的文字颜色是不同的,可以通过 insideColor 设置水波处的文字颜色,color 设置背景处的文字颜色。
图表中间默认显示百分比数据,如果你需要将其设置为其他文字内容,可以通过 formatter 指定,这与 ECharts 的其他格式化函数也是相同的。
formatter 可以是一个字符串,其中 ‘{a}’、’{b}’、’{c}’ 会被分别替换成系列名称、数据名称、数据值。
通篇贴
<!DOCTYPE html>
<html lang="en">
<head>
    <meta charset="UTF-8">
    <title>Title</title>
    <script src="https://cdnjs.cloudflare.com/ajax/libs/echarts/3.4.0/echarts.min.js"></script>
    <script src="http://echarts.baidu.com/resource/echarts-liquidfill-1.0.4/dist/echarts-liquidfill.js"></script>
</head>
<body>
<div id="main" style="width: 900px;height:800px;"></div>
<script>
    var myChart = echarts.init(document.getElementById('main'));

    var option = {
        series: [{
            type: 'liquidFill',
            data: [0.6, {
                value: 0.5,
                direction: 'left',
                itemStyle: {
                    normal: {
                        color:'red',
                        formatter: 'hehehehe',
                        textStyle: {
                            color: 'pink',
                            insideColor: 'yellow',
                            fontSize: 50
                        }
                    }
                }
            }, {
                value: 0.4,
                direction: 'left',
                label: {
                    normal: {
                        textStyle: {
                            color: 'red',
                            insideColor: 'yellow',
                            fontSize: 50
                        }
                    }
                }
            }, 0.3],
            direction: 'left',
            radius: '40%',
            shape: 'diamond',
            center: ['20%', '20%']
        }, {
            type: 'liquidFill',
            data: [0.6, {
                value: 0.5,
                direction: 'left',
                label: {
                    normal: {
                        color: 'red'
                    }
                }
            }, 0.4, 0.3],
            direction: 'right',
            radius: '40%',
            shape: 'rect',
            center: ['80%', '25%']
        }, {
            type: 'liquidFill',
            data: [0.6, {
                value: 0.5,
                direction: 'left',
                itemStyle: {
                    normal: {
                        color: 'red'
                    }
                }
            }, 0.4, 0.3],
            radius: '40%',
            shape: 'roundRect',
            center: ['20%', '80%'],
            backgroundStyle: {
                borderColor: '#156ACF',
                borderWidth: 1,
                shadowColor: 'rgba(0, 0, 0, 0.4)',
                shadowBlur: 20
            },
            outline: {
                show: false
            },
            waveAnimation: false, // 禁止左右波动
        }, {
            type: 'liquidFill',
            data: [0.6, {
                value: 0.5,
                direction: 'left',
                itemStyle: {
                    normal: {
                        color: 'red'
                    }
                }
            }, 0.4, 0.3],
            radius: '50%',
            shape: 'pin',
            center: ['80%', '75%'],
            amplitude: 0,
            waveAnimation: false,
            outline: {
                show: false
            },
            backgroundStyle: {
                shadowColor: 'rgba(0, 0, 0, 0.4)',
                shadowBlur: 20
            }
        },{
            type: 'liquidFill',
            data: [{
                name:'boy',
                value: 0.56,
                direction: 'left',
                itemStyle: {
                    normal: {
                        color: 'green'
                    }
                }
            }, {
                name:'girl',
                value: 0.5,
                direction: 'right',
                itemStyle: {
                    normal: {
                        color: 'blue'
                    }
                }
            }, {
                value: 0.4,
                direction: 'none',
                itemStyle: {
                    normal: {
                        color: 'yellow'
                    }
                }
            }, {
                value: 0.3,
                direction: 'left',
                itemStyle: {
                    normal: {
                        color: 'red'
                    }
                }
            }],
//            radius: '90%',
            outline: {
                show: false
            },
            backgroundStyle: {
                borderColor: '#156ACF',
                borderWidth: 1,
                shadowColor: 'rgba(0, 0, 0, 0.4)',
                shadowBlur: 20
            },
            shape: 'path://M367.855,428.202c-3.674-1.385-7.452-1.966-11.146-1.794c0.659-2.922,0.844-5.85,0.58-8.719 c-0.937-10.407-7.663-19.864-18.063-23.834c-10.697-4.043-22.298-1.168-29.902,6.403c3.015,0.026,6.074,0.594,9.035,1.728 c13.626,5.151,20.465,20.379,15.32,34.004c-1.905,5.02-5.177,9.115-9.22,12.05c-6.951,4.992-16.19,6.536-24.777,3.271 c-13.625-5.137-20.471-20.371-15.32-34.004c0.673-1.768,1.523-3.423,2.526-4.992h-0.014c0,0,0,0,0,0.014 c4.386-6.853,8.145-14.279,11.146-22.187c23.294-61.505-7.689-130.278-69.215-153.579c-61.532-23.293-130.279,7.69-153.579,69.202 c-6.371,16.785-8.679,34.097-7.426,50.901c0.026,0.554,0.079,1.121,0.132,1.688c4.973,57.107,41.767,109.148,98.945,130.793 c58.162,22.008,121.303,6.529,162.839-34.465c7.103-6.893,17.826-9.444,27.679-5.719c11.858,4.491,18.565,16.6,16.719,28.643 c4.438-3.126,8.033-7.564,10.117-13.045C389.751,449.992,382.411,433.709,367.855,428.202z',
            label: {
                normal: {
                    position: ['40%', '40%'],
                    formatter: function(param) {
                        //return param.seriesName + '\n'
                        //+ param.name + '\n'
                        // + 'Value: ' + param.value;
                        return param.name + '\n'
                         + parseInt(param.value * 100) + '%'
                    },
                    textStyle: {
                        insideColor: 'yellow',
                        fontSize: 40,
                        color: '#D94854'
                    }
                }
            }
        }]
    };
    // 使用刚指定的配置项和数据显示图表。
    myChart.setOption(option);
</script>
</body>
</html>