R语言中insol语言包,提供了生成DEM的shadow的函数,这个是我找了好久才找到的,心累啊!!!!!!!!!
1、首先需要安装RStudio
2、在RStudio->Tools->Install Packages中搜索insol,进行安装
3、编写R语言源文件
这里需要注意在前面几行加上
1 library(insol)
2 library(rgdal)
3 library(raster)
由于数据量太多,画图的时候,出现了一些问题,是画图的面板太小导致的,这里需要打开Zoom

具体的代码如下:
library(insol)
library(rgdal)
library(raster)
# define the sun vector: northwest at 15 degrees elevation
sv=normalvector(75,315)
## create a pyramid 100 units by side and 50 nunits tall
m=matrix(0,nrow=100,ncol=100)
for (i in 1:100){ for (j in 1:100){
m[i,j]=50-max(abs(i-50),abs(j-50)) }}
## place it on a large flat expanse
mm=matrix(0,nrow=500,ncol=500)
mm[201:300,201:300]=m
## calulate and plot the cast shadows from the sun
sh=doshade(mm,sv,1)
image(t(sh[nrow(sh):1,]),col=grey(1:100/100))
contour(mm,add=TRUE,col='sienna1',nlevels=25)
## (mm is symmetrical, no need to rotate as for shadows)
## plot cast shadows on mountain terrain, sun at NW, 25 degrees elevation
zipfile=tempfile()
download.file("http://www.meteoexploration.com/R/insol/data/dempyrenees.asc.zip",zipfile)
header=read.table(unz(zipfile,'dempyrenees.asc'),nrows=6)
dem = read.table(unz(zipfile,'dempyrenees.asc'),skip=6)
dem=as.matrix(dem)
unlink(zipfile)
cellsize=header[5,2]
sv=normalvector(65,315)
image(t(dem[nrow(dem):1,]),col=grey(1:100/100)) ## 显示原始的DEM图
sh=doshade(dem,sv,cellsize)
image(t(sh[nrow(sh):1,]),col=grey(1:100/100))
## add intensity of illumination in this case sun at NW 45 degrees elevation
sv=normalvector(45,315)
grd=cgrad(dem,cellsize)
hsh=grd[,,1]*sv[1]+grd[,,2]*sv[2]+grd[,,3]*sv[3]
## remove negative incidence angles (self shading)
hsh=(hsh+abs(hsh))/2
sh=doshade(dem,sv,cellsize)
hshsh=hsh*sh
image(t(hshsh[nrow(sh):1,]),col=grey(1:100/100))
## Not run:
## plot cast shadows on mountain terrain using raster
sv=normalvector(65,315)
require(rgdal)
require(raster)
demfile=tempfile()
download.file("http://www.meteoexploration.com/R/insol/data/dempyrenees.tif",demfile)
dem=raster(demfile)
sh=doshade(dem,sv)
plot(sh,col=grey(0:1),legend=FALSE)
contour(dem,add=TRUE,col='sienna1',lwd=.5,nlevels=50)
## add intensity of illumination in this case sun at NW 45 degrees elevation
sv=normalvector(45,315)
grd=cgrad(dem)
hsh=grd[,,1]*sv[1]+grd[,,2]*sv[2]+grd[,,3]*sv[3]
## remove negative incidence angles (self shading)
hsh=(hsh+abs(hsh))/2
## convert back to raster as dem and add shadows
hsh=raster(hsh,crs=projection(dem))
extent(hsh)=extent(dem)
sh=doshade(dem,sv)
plot(hsh*sh,col=grey(1:100/100),legend=FALSE)
unlink(demfile)
## End(Not run)
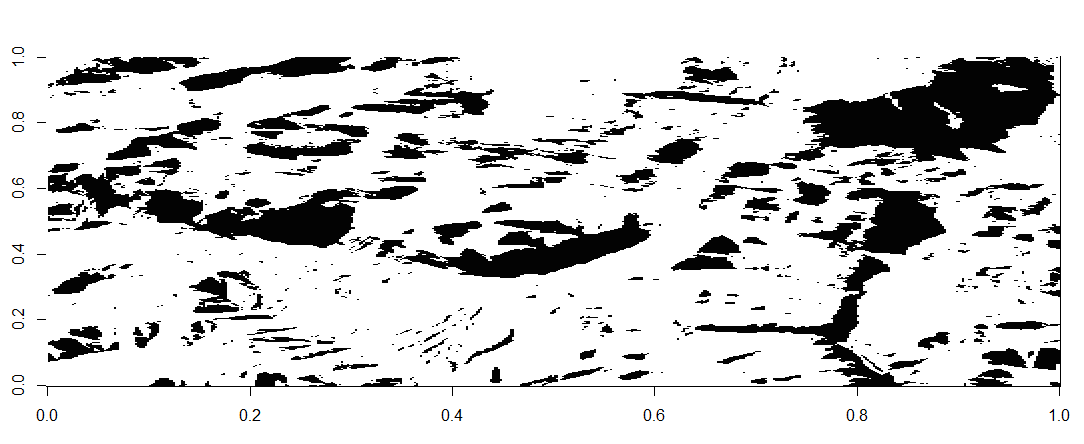
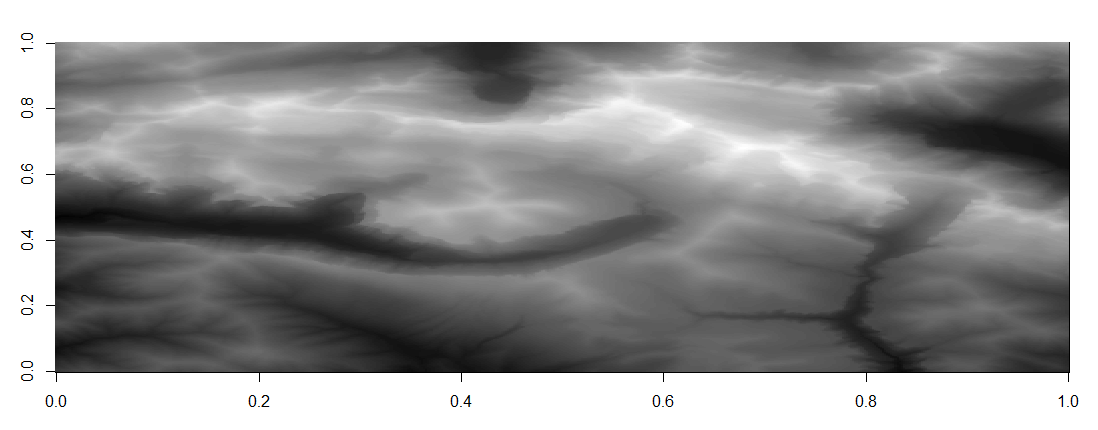
效果图:
原始的高程图
设置光源的位置,生成的阴影图