版权声明:本文为博主原创文章,欢迎转载。 https://blog.csdn.net/samylee/article/details/84940998
TensorFlow-tensorboard结果可视化
硬件:NVIDIA-GTX1080
软件:Windows7、python3.6.5、tensorflow-gpu-1.4.0
一、基础知识
tensorboard为TensorFlow网络可视化的接口
tf.name_scope for network architecture
tf.summary(histogram, scalar) for variable
二、代码展示
import tensorflow as tf
import numpy as np

#name_scope for network architecture
#summary for variable

def add_layer(inputs, in_size, out_size, n_layer, activation_function=None):
    layer_name = 'layer%s' % n_layer
    with tf.name_scope(layer_name):
        with tf.name_scope('weights'):
            Weights = tf.Variable(tf.random_normal([in_size, out_size]), name='W')

            # wanna see weights by histogram
            tf.summary.histogram(layer_name + '/weights', Weights)

        with tf.name_scope('biases'):
            biases = tf.Variable(tf.zeros([1, out_size]) + 0.1, name='b')

            # wanna see weights by histogram
            tf.summary.histogram(layer_name + '/biases', biases)

        with tf.name_scope('Wx_plus_b'):
            Wx_plus_b = tf.add(tf.matmul(inputs, Weights), biases)
        if activation_function is None:
            outputs = Wx_plus_b
        else:
            outputs = activation_function(Wx_plus_b, )

        # wanna see outputs by histogram
        tf.summary.histogram(layer_name + '/outputs', outputs)

    return outputs

x_data = np.linspace(-1, 1, 300)[:, np.newaxis]
noise = np.random.normal(0, 0.05, x_data.shape)
y_data = np.square(x_data) - 0.5 + noise

with tf.name_scope('inputs'):
    xs = tf.placeholder(tf.float32, [None, 1], name='x_input')
    ys = tf.placeholder(tf.float32, [None, 1], name='y_input')

l1 = add_layer(xs, 1, 10, n_layer=1, activation_function=tf.nn.relu)
prediction = add_layer(l1, 10, 1, n_layer=2, activation_function=None)

with tf.name_scope('loss'):
    loss = tf.reduce_mean(tf.reduce_sum(tf.square(ys - prediction),
                                        reduction_indices=[1]))

    # wanna see loss by scalar(coordinate)
    tf.summary.scalar('loss', loss)

with tf.name_scope('train'):
    train_step = tf.train.GradientDescentOptimizer(0.1).minimize(loss)

sess = tf.Session()

# merge all summary like variables initializer
merged = tf.summary.merge_all()

#apply summary, ready to save, to "logs" directory
writer = tf.summary.FileWriter("logs/", sess.graph)

init = tf.global_variables_initializer()
sess.run(init)

for step in range(1000):
    sess.run(train_step, feed_dict={xs: x_data, ys: y_data})
    if step % 50 == 0:
        #show merge like show loss
        result = sess.run(merged,
                          feed_dict={xs: x_data, ys: y_data})
        #save to summary
        writer.add_summary(result, step)

sess.close()
三、执行tensorboard
3.1 运行上例程序,“logs”文件夹下得到保存文件
3.2 打开cmd,进入logs文件夹同级目录
3.3 运行 tensorboard --logdir=logs (注意不要用"logs")
3.4 打开Google Chrome(其他浏览器不保证),输入3.3运行结束的网址
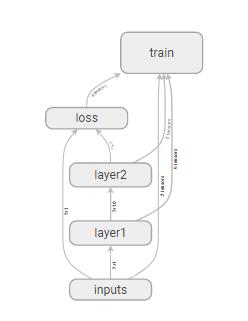
四、结果可视化


任何问题请加唯一QQ2258205918(名称samylee)!