目录
相关命令
cachestat 和 cachetop都用到的一些字段,man解释如下
       TIME   Timestamp.

       HITS   Number of page cache hits.

       MISSES Number of page cache misses.

       DIRTIES
              Number of dirty pages added to the page cache.

       READ_HIT%
              Read hit percent of page cache usage.

       WRITE_HIT%
              Write hit percent of page cache usage.

       BUFFERS_MB
              Buffers size taken from /proc/meminfo.

       CACHED_MB
              Cached amount of data in current page cache taken from /proc/meminfo.
Ubuntu 二进制安装这两个工具
sudo apt-key adv --keyserver keyserver.ubuntu.com --recv-keys 4052245BD4284CDD
echo "deb https://repo.iovisor.org/apt/$(lsb_release -cs) $(lsb_release -cs) main" | sudo tee /etc/apt/sources.list.d/iovisor.list
sudo apt-get update
sudo apt-get install bcc-tools libbcc-examples linux-headers-$(uname -r)
Centos上安装bcc
# 安装 ELRepo
rpm --import https://www.elrepo.org/RPM-GPG-KEY-elrepo.org
rpm -Uvh https://www.elrepo.org/elrepo-release-7.0-3.el7.elrepo.noarch.rpm

# 安装新内核
yum remove -y kernel-headers kernel-tools kernel-tools-libs
yum --enablerepo="elrepo-kernel" install -y kernel-ml kernel-ml-devel kernel-ml-headers kernel-ml-tools kernel-ml-tools-libs kernel-ml-tools-libs-devel

#更新 Grub 后重启
grub2-mkconfig -o /boot/grub2/grub.cfg
grub2-set-default 0
reboot

#重启后确认内核已经升级为 4.20.0.-1.el7.elrepo.x86_64
uname -r

# 安装 bbc-tools
yum install -y bcc-tools

#配置PATH路径
export PATH=$PATH:/usr/share/bcc/tools

#验证安装成功
cachestat
基于二进制安装pcstat
if [ $(uname -m) == "x86_64" ] ; then
    curl -L -o pcstat https://github.com/tobert/pcstat/raw/2014-05-02-01/pcstat.x86_64
else
    curl -L -o pcstat https://github.com/tobert/pcstat/raw/2014-05-02-01/pcstat.x86_32
fi
chmod 755 pcstat
执行pcstat的结果
pcstat /bin/cat hehe.log
|----------+----------------+------------+-----------+---------|
| Name     | Size           | Pages      | Cached    | Percent |
|----------+----------------+------------+-----------+---------|
| /bin/cat | 35064          | 9          | 0         | 000.000 |
| hehe.log | 25             | 1          | 0         | 000.000 |
|----------+----------------+------------+-----------+---------|

cat hehe.log
aaaaaaa
bbbbbbbbbb
ccccc

#第二次就执,数据就被缓存了
pcstat /bin/cat hehe.log
|----------+----------------+------------+-----------+---------|
| Name     | Size           | Pages      | Cached    | Percent |
|----------+----------------+------------+-----------+---------|
| /bin/cat | 35064          | 9          | 9         | 100.000 |
| hehe.log | 25             | 1          | 1         | 100.000 |
|----------+----------------+------------+-----------+---------|
/bin/cat 的大小是35064字节,一个页面大小是4K,所以 35064/(4*1024.0) = 8.5,也就是占用了9个页面
测试缓存命中情况
用dd写入一个文件,再反复读取这个文件
dd if=/dev/sda1 of=file bs=1M count=512
echo 3 > /proc/sys/vm/drop_caches

#这个时候缓存是空的
pcstat file
|----------+----------------+------------+-----------+---------|
| Name     | Size           | Pages      | Cached    | Percent |
|----------+----------------+------------+-----------+---------|
| file     | 536870912      | 131072     | 0         | 000.000 |
|----------+----------------+------------+-----------+---------|
测试读取数据
dd if=file of=/dev/null bs=1M
512+0 records in
512+0 records out
536870912 bytes (537 MB, 512 MiB) copied, 5.04981 s, 106 MB/s

cachetop
PID      UID      CMD              HITS     MISSES   DIRTIES  READ_HIT%  WRITE_HIT%
3928 	root     python                  5        0        0     100.0%       0.0%
3972 	root     python                  5        0        0     100.0%       0.0%
4066 	root     dd                  86868    85505        0      50.4%      49.6%


#第二次读取
dd if=file of=/dev/null bs=1M
512+0 records in
512+0 records out
536870912 bytes (537 MB, 512 MiB) copied, 0.182855 s, 2.9 GB/s

cachetop
PID      UID      CMD              HITS     MISSES   DIRTIES  READ_HIT%  WRITE_HIT%
4079 	root     bash                  197        0        0     100.0%       0.0%
4079 	root     dd                 131605        0        0     100.0%       0.0%
可以看到第二次读取的时候性能大幅度提升了,再看pcstat情况
pcstat file
|----------+----------------+------------+-----------+---------|
| Name     | Size           | Pages      | Cached    | Percent |
|----------+----------------+------------+-----------+---------|
| file     | 536870912      | 131072     | 131072    | 100.000 |
|----------+----------------+------------+-----------+---------|
测试direct I/O
用dd读取一个文件,加入direct标志
dd if=file of=/dev/null bs=1M iflag=direct
512+0 records in
512+0 records out
536870912 bytes (537 MB, 512 MiB) copied, 4.91659 s, 109 MB/s
通过监控命令观察运行情况
cachetop 3
14:14:13 Buffers MB: 9 / Cached MB: 614 / Sort: HITS / Order: ascending
PID      UID      CMD              HITS     MISSES   DIRTIES  READ_HIT%  WRITE_HIT%
4161 root     python                  1        0        0     100.0%       0.0%
4162 root     dd                    518        0        0     100.0%       0.0%
这里对 dd 监控的结果是每秒钟 HITS是 518,cachetop是3秒监控一次
518*4/1024.0/3.0,也就是每秒读取0.67M的数据
通过strace dd 看结果,再读 file 这个文件的时候,确实是用了 O_DIRECT标志
openat(AT_FDCWD, "file", O_RDONLY|O_DIRECT) = 3
dup2(3, 0) = 0
close(3) = 0
lseek(0, 0, SEEK_CUR) = 0
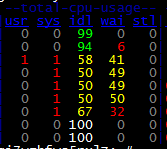
openat(AT_FDCWD, "/dev/null", O_WRONLY|O_CREAT|O_TRUNC, 0666) = 3用dstat看,dd读取的那段时间,iowait也是很高的
把dd 的直接I/O选项去掉,再执行一次
echo 3 > /proc/sys/vm/drop_caches
dd if=file of=/dev/null bs=1M
512+0 records in
512+0 records out
536870912 bytes (537 MB, 512 MiB) copied, 4.91158 s, 109 MB/s


cachetop
PID      UID      CMD              HITS     MISSES   DIRTIES  READ_HIT%  WRITE_HIT%
4397 	root     python                  2        0        0     100.0%       0.0%
4398 	root     dd                  34198    33027        0      50.9%      49.1%
这里对 dd 监控的结果是每秒钟的 HITS是34198,cachetop是3秒监控一次
34198*4/1024.0/3.0,也就是每秒钟读取44M的数据,这次是正常了
关于O_DIRECT 标志的说明
       O_DIRECT (since Linux 2.4.10)
              Try to minimize cache effects of the I/O to and from this
              file.  In general this will degrade performance, but it is
              useful in special situations, such as when applications do
              their own caching.  File I/O is done directly to/from user-
              space buffers.  The O_DIRECT flag on its own makes an effort
              to transfer data synchronously, but does not give the
              guarantees of the O_SYNC flag that data and necessary metadata
              are transferred.  To guarantee synchronous I/O, O_SYNC must be
              used in addition to O_DIRECT.  See NOTES below for further
              discussion.
直接I/O一般是上层应用有自己的缓存系统,就不需要操作系统级别的缓存了
直接读写磁盘一般是用于 存储系统的场合,比如数据库,文件系统,读写的时候可以绕过操作系统的文件系统这一层
内存泄露检查
系统给进程分配内存空间时,用户空间内存包括多个不同的内存段,如只读段,数据段,堆,栈,文件映射等,这些内存段是应用程序使用内存的基本方
比如程序中定义了局部变量,如int a,char data[64]
栈内存由系统自动分配和管理,一旦程序运行超出了这个局部变量的作用域,栈内存就会被系统自动回收,所以不会产生内存泄露问题
堆内存由应用程序自己来分配和管理,除非程序退出,这些堆内存并不会被系统自动释放,需要程序明确调用库函数free()来释放他们,如果程序没有正确释放堆内存,就会造成内存泄露
各种段对于泄露的情况
1.只读段,包括程序的代码和常量,由于是只读的,不会再分配新的内存,不会产生内存泄露
2.数据段,包括全景变量和静态变量,这些变量定义时就已经确定了大小,不会产生内存泄露
3.内存映射段,包括动态链接和共享内存,其中共享内存由程序动态分配和管理,如果忘记回收,就会跟
堆内存造成类似的泄露问题
虽然可以通过OOM机制来杀死进程,但在OOM之前,可能会引发一连串的反应,导致严重的性能问题
比如,其他西域内存的进程,可能无法分配新的内存,内存不足又会出发系统的缓存回收以及SWAP机制,从而进一步导致I/O的性能问题
一段有问题的程序
#include <stdio.h>
#include <stdlib.h>
#include <pthread.h>
#include <unistd.h>

long long *fibonacci(long long *n0, long long *n1) {

        long long *v = (long long *) calloc(1024, sizeof(long long));
        *v = *n0 + *n1;
        return v;
}

void *child(void *arg) {
        long long n0 = 0;
        long long n1 = 1;
        long long *v = NULL;
        int n = 2;
        for (n = 2; n > 0; n++) {
                v = fibonacci(&n0, &n1);
                n0 = n1;
                n1 = *v;
                printf("%dth => %lld\n", n, *v);
                sleep(1);
                /* 没有调用 free */
                //free(v);
        }
}


int main(void) {
        pthread_t tid;
        pthread_create(&tid, NULL, child, NULL);
        pthread_join(tid, NULL);
        printf("main thread exit\n");
        return 0;
}

//执行结果
2th => 1
3th => 2
4th => 3
5th => 5
6th => 8
7th => 13
8th => 21
9th => 34
10th => 55
11th => 89
12th => 144
13th => 233
14th => 377
15th => 610
16th => 987
17th => 1597
18th => 2584
19th => 4181
20th => 6765
21th => 10946
22th => 17711
23th => 28657
24th => 46368
25th => 75025
26th => 121393
27th => 196418
28th => 317811
29th => 514229
30th => 832040
31th => 1346269
32th => 2178309
33th => 3524578
34th => 5702887
35th => 9227465
36th => 14930352
执行这段代码(编译的时候要加 -lpthread),用vmstat,和memleak观察如下
vmstat 1
procs -----------memory---------- ---swap-- -----io---- -system-- ------cpu-----
 r  b   swpd   free   buff  cache   si   so    bi    bo   in   cs us sy id wa st
 0  0      0 3049700  96684 806428    0    0    25     5   53   99  0  0 100  0  0
 0  0      0 3049692  96684 806464    0    0     0     0  151  238  0  0 100  0  0
 0  0      0 3049692  96692 806456    0    0     0    36  148  232  0  0 100  0  0
 0  0      0 3049436  96692 806464    0    0     0     0  156  243  0  0 100  0  0
 0  0      0 3049436  96692 806464    0    0     0     0  177  262  1  0 100  0  0
 0  0      0 3049468  96692 806464    0    0     0     0  126  222  0  0 100  0  0
 。。。。。。
 0  0      0 3049376  96700 806456    0    0     0    16  146  243  0  0 100  1  0
。。。。。。
 1  0      0 3049392  96700 806480    0    0     0     0  160  246  0  0 100  0  0
 。。。。。
 0  0      0 3049392  96700 806480    0    0     0     0  163  257  0  0 100  0  0
 0  0      0 3049040  96700 806480    0    0     0     0  175  287  0  1 100  0  0
 0  0      0 3049144  96700 806480    0    0     0     0  138  234  1  0 100  0  0
。。。。。。
 0  0      0 3049176  96700 806480    0    0     0     0  169  267  1  0 100  0  0


memleak -p 7438 -a
Attaching to pid 7438, Ctrl+C to quit.
[13:24:11] Top 10 stacks with outstanding allocations:
        addr = 7f1ec401d010 size = 8192
        addr = 7f1ec4021030 size = 8192
        addr = 7f1ec401b000 size = 8192
        addr = 7f1ec401f020 size = 8192
        32768 bytes in 4 allocations from stack
                fibonacci+0x1f [hehe]
                child+0x56 [hehe]
                start_thread+0xdb [libpthread-2.27.so]
[13:24:16] Top 10 stacks with outstanding allocations:
        addr = 7f1ec401d010 size = 8192
        addr = 7f1ec402b080 size = 8192
        addr = 7f1ec4027060 size = 8192
        addr = 7f1ec4029070 size = 8192
        addr = 7f1ec4021030 size = 8192
        addr = 7f1ec401b000 size = 8192
        addr = 7f1ec4023040 size = 8192
        addr = 7f1ec4025050 size = 8192
        addr = 7f1ec401f020 size = 8192
        73728 bytes in 9 allocations from stack
                fibonacci+0x1f [hehe]
                child+0x56 [hehe]
                start_thread+0xdb [libpthread-2.27.so]
[13:24:21] Top 10 stacks with outstanding allocations:
        addr = 7f1ec401d010 size = 8192
        addr = 7f1ec402b080 size = 8192
        addr = 7f1ec4027060 size = 8192
        addr = 7f1ec4029070 size = 8192
        addr = 7f1ec402d090 size = 8192
        addr = 7f1ec40350d0 size = 8192
        addr = 7f1ec4021030 size = 8192
        addr = 7f1ec401b000 size = 8192
        addr = 7f1ec402f0a0 size = 8192
        addr = 7f1ec40310b0 size = 8192
        addr = 7f1ec4023040 size = 8192
        addr = 7f1ec40330c0 size = 8192
        addr = 7f1ec4025050 size = 8192
        addr = 7f1ec401f020 size = 8192
        114688 bytes in 14 allocations from stack
                fibonacci+0x1f [hehe]
                child+0x56 [hehe]
                start_thread+0xdb [libpthread-2.27.so]
[13:24:26] Top 10 stacks with outstanding allocations:
        addr = 7f1ec401d010 size = 8192
        addr = 7f1ec402b080 size = 8192
        addr = 7f1ec4027060 size = 8192
        addr = 7f1ec403b100 size = 8192
        addr = 7f1ec40390f0 size = 8192
        addr = 7f1ec4029070 size = 8192
        addr = 7f1ec402d090 size = 8192
        addr = 7f1ec403f120 size = 8192
        addr = 7f1ec40350d0 size = 8192
        addr = 7f1ec403d110 size = 8192
        addr = 7f1ec4021030 size = 8192
        addr = 7f1ec401b000 size = 8192
        addr = 7f1ec402f0a0 size = 8192
        addr = 7f1ec40310b0 size = 8192
        addr = 7f1ec40370e0 size = 8192
        addr = 7f1ec4023040 size = 8192
        addr = 7f1ec40330c0 size = 8192
        addr = 7f1ec4025050 size = 8192
        addr = 7f1ec401f020 size = 8192
        155648 bytes in 19 allocations from stack
                fibonacci+0x1f [hehe]
                child+0x56 [hehe]
                start_thread+0xdb [libpthread-2.27.so]
实际会比这个例子要复杂很多,如
malloc和free通常并不是承兑出现,而是需要你,在每个异常处理路径和成功路径上都释放内存
在多线程程序中,一个县城中分配的内存,可能会在另一个线程中访问和释放
更复杂的是,在第三方的库函数中,隐式分配的内存可能需要应用程序显示释放
为了避免内存泄露,重要的一点是养成良好的编程习惯,比如分配内存后,一定要先写好内存释放的代码,再去开发其他逻辑