				版权声明:本文为博主原创文章,未经博主允许不得转载。					https://blog.csdn.net/Grace_0642/article/details/79692593				</div>
							            <div id="content_views" class="markdown_views">
						<!-- flowchart 箭头图标 勿删 -->
						<svg xmlns="http://www.w3.org/2000/svg" style="display: none;"><path stroke-linecap="round" d="M5,0 0,2.5 5,5z" id="raphael-marker-block" style="-webkit-tap-highlight-color: rgba(0, 0, 0, 0);"></path></svg>
						<p></p><div class="toc"><div class="toc">
三线表
在写论文的时候我们常常会用到三线表,三线表的基本语法就是下面这个样子的。
如果是在双栏的环境里,如果我们的表格比较大,我们一般需要在表格的环境中加星号, 如果是表格只占一栏,这个时候我们就不需要加星号,我们假设我们使用表格的情况是占双栏的。三线表的精华就是那三根线了啦,用的命令就是 \toprule ,\midrule,\bottomrule 这三个命令。就是上中下,然后就是与rule 的结合。
\begin{table*}
\centering
\caption{****}
\begin{tabular}{c|c|c|}
\toprule
\midrule
\bottomrule
\end{tabular}
\label{tbl:table-example}

\end{table*}
- 1
- 2
- 3
- 4
- 5
- 6
- 7
- 8
- 9
- 10
- 11
- 12
需要强调一点的是,在写论文的时候表格的标题一般都是在表格的上方,所以我们用caption命令的时候一般是在表格环境tabular的开头。
假设我们要写的表格是下面这个样子的
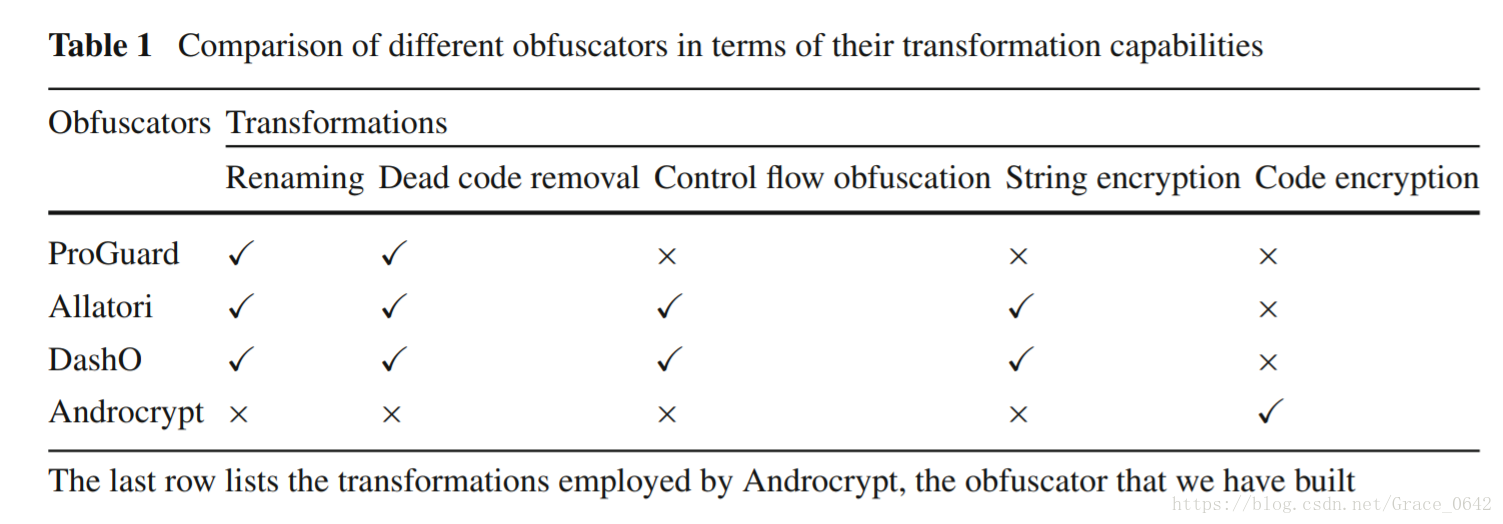
我们先来分析一下我们的表格,就是格子之间是没有竖线的,这个可以通过我们的tabular 之后的环境来控制
然后发现表格的内容是靠左的。这是一个典型的三线表。里面唯一的东西就是钩钩和叉叉
这个时候我们就可以这样来写我们的代码。
\begin{table*}
\centering
\caption{Comparison of different obfuscations in terms of their transformation capabilities}
\begin{tabular}{llllll} % 控制表格的格式
\toprule
\multirow{2}{*}obfuscators & \multicolumn{5}{l}{Transformations}   \\
\cline{2-6}  % 这部分是画一条横线在2-6 排之间
   &    Renaming & Dead code removal & control flow obfuscation & string encryption & code encryption \\
  \midrule
  Proguard &  \checkmark & $\times$  & $\times$ & \checkmark  & $\times$ \\
  Allatori & \checkmark & $\times$  & $\times$ & \checkmark  & $\times$ \\
  DashO & \checkmark & $\times$  & $\times$ & \checkmark  & $\times$ \\
  Androcrypt & \checkmark & $\times$  & $\times$ & \checkmark  & $\times$ \\
  \bottomrule
  \end{tabular}
  \label{tbl:table1}
\end{table*}
- 1
- 2
- 3
- 4
- 5
- 6
- 7
- 8
- 9
- 10
- 11
- 12
- 13
- 14
- 15
- 16
- 17
表格的合并
在LaTeX中我们常常需要用到一些表格的合并和拆分,其实在LaTeX中是没有表格的拆分这个概念的,我们只有合并这个概念。
所以我们在设计表格的时候必须自己要考虑清楚问题,怎么做出合并。
在这里我们用到的就是\multirow{合并的单元格也就是行数}{*}{内容}
\multicolumn{合并的列数}{表格单元格的格式}{内容}
当我们要用到表格的合并和分割的时候,我们需要在导言区添加以下的内容:
\usepackage{multirow}
如果我们要画一个下面这个表格
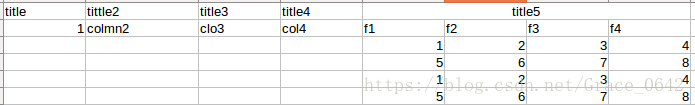
我们就要先观察好了这个表格的布局,其实前4列是需要合并单元格的,就是要把每行都合并起来
然后在后面的4列一列的标题我们是需要合并的。
这个时候我们的代码是可以这么写的
\begin{table}
\centering
\caption{The title of the table}
\begin{tabular}{|c|c|c|c|c|c|c|c|}
title & title2 & title3 & title4 & \multicolumn{4}{c|}{title5} \\
\hline
\mulitrow{5}{*}{1} & \multirow{5}{*}{column2} & \multirow{5}{*}{clo3} & \multirow{5}{*}{clo4}
& f1 & f2 & f3 & f4 \\
\cline{5-8}
 & & & & 1 & 2 & 3 & 4 \\
 \cline{5-8}
  & & & & 5 & 6& 7 & 8 \\
  \cline{5-8}
   & & & & 1 & 2 & 3 & 4 \\
 \cline{5-8}
   & & & & 5 & 6& 7 & 8 \\
 \hline
\end{tabular}
\end{table}
- 1
- 2
- 3
- 4
- 5
- 6
- 7
- 8
- 9
- 10
- 11
- 12
- 13
- 14
- 15
- 16
- 17
- 18
- 19
					<link href="https://csdnimg.cn/release/phoenix/mdeditor/markdown_views-2011a91181.css" rel="stylesheet">
            </div>
				版权声明:本文为博主原创文章,未经博主允许不得转载。					https://blog.csdn.net/Grace_0642/article/details/79692593				</div>
							            <div id="content_views" class="markdown_views">
						<!-- flowchart 箭头图标 勿删 -->
						<svg xmlns="http://www.w3.org/2000/svg" style="display: none;"><path stroke-linecap="round" d="M5,0 0,2.5 5,5z" id="raphael-marker-block" style="-webkit-tap-highlight-color: rgba(0, 0, 0, 0);"></path></svg>
						<p></p><div class="toc"><div class="toc">