
# coding=utf-8
from matplotlib import pyplot as plt
from matplotlib import font_manager
a=[131, 98, 125, 131, 124, 139, 131, 117, 128, 108, 135, 138, 131, 102, 107, 114, 119, 128, 121, 142, 127, 130, 124, 101, 110, 116, 117, 110, 128, 128, 115, 99, 136, 126, 134, 95, 138, 117, 111,78, 132, 124, 113, 150, 110, 117, 86, 95, 144, 105, 126, 130,126, 130, 126, 116, 123, 106, 112, 138, 123, 86, 101, 99, 136,123, 117, 119, 105, 137, 123, 128, 125, 104, 109, 134, 125, 127,105, 120, 107, 129, 116, 108, 132, 103, 136, 118, 102, 120, 114,105, 115, 132, 145, 119, 121, 112, 139, 125, 138, 109, 132, 134,156, 106, 117, 127, 144, 139, 139, 119, 140, 83, 110, 102,123,107, 143, 115, 136, 118, 139, 123, 112, 118, 125, 109, 119, 133,112, 114, 122, 109, 106, 123, 116, 131, 127, 115, 118, 112, 135,115, 146, 137, 116, 103, 144, 83, 123, 111, 110, 111, 100, 154,136, 100, 118, 119, 133, 134, 106, 129, 126, 110, 111, 109, 141,120, 117, 106, 149, 122, 122, 110, 118, 127, 121, 114, 125, 126,114, 140, 103, 130, 141, 117, 106, 114, 121, 114, 133, 137, 92,121, 112, 146, 97, 137, 105, 98, 117, 112, 81, 97, 139, 113,134, 106, 144, 110, 137, 137, 111, 104, 117, 100, 111, 101, 110,105, 129, 137, 112, 120, 113, 133, 112, 83, 94, 146, 133, 101,131, 116, 111, 84, 137, 115, 122, 106, 144, 109, 123, 116, 111,111, 133, 150]
#计算组数
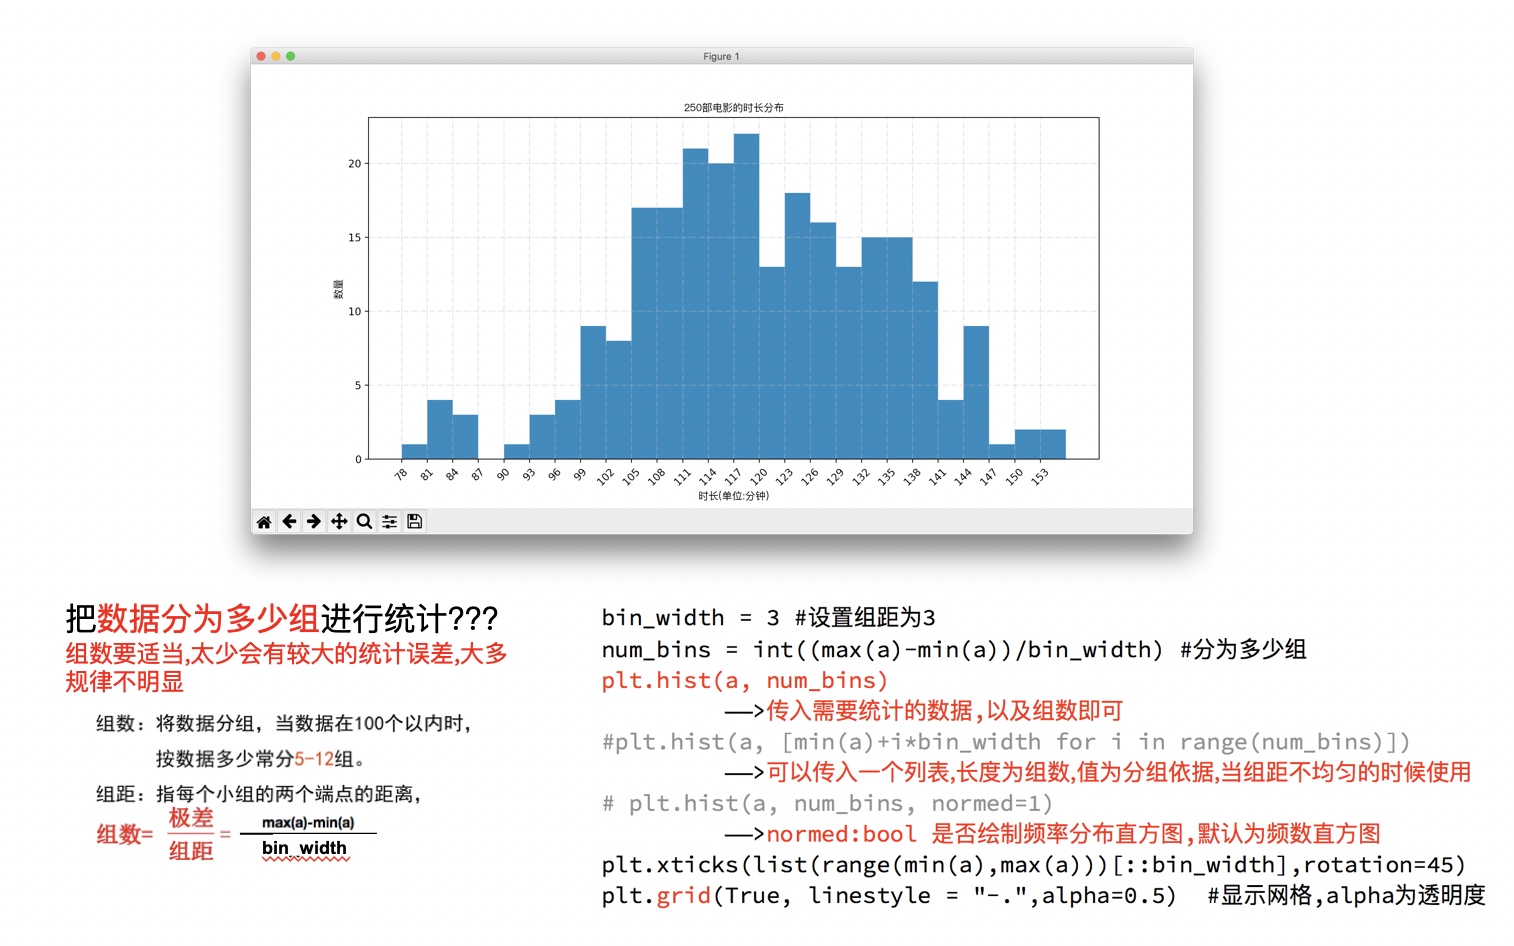
d = 3 #组距
num_bins = (max(a)-min(a))//d
print(max(a),min(a),max(a)-min(a))
print(num_bins)
#设置图形的大小
plt.figure(figsize=(20,8),dpi=80)
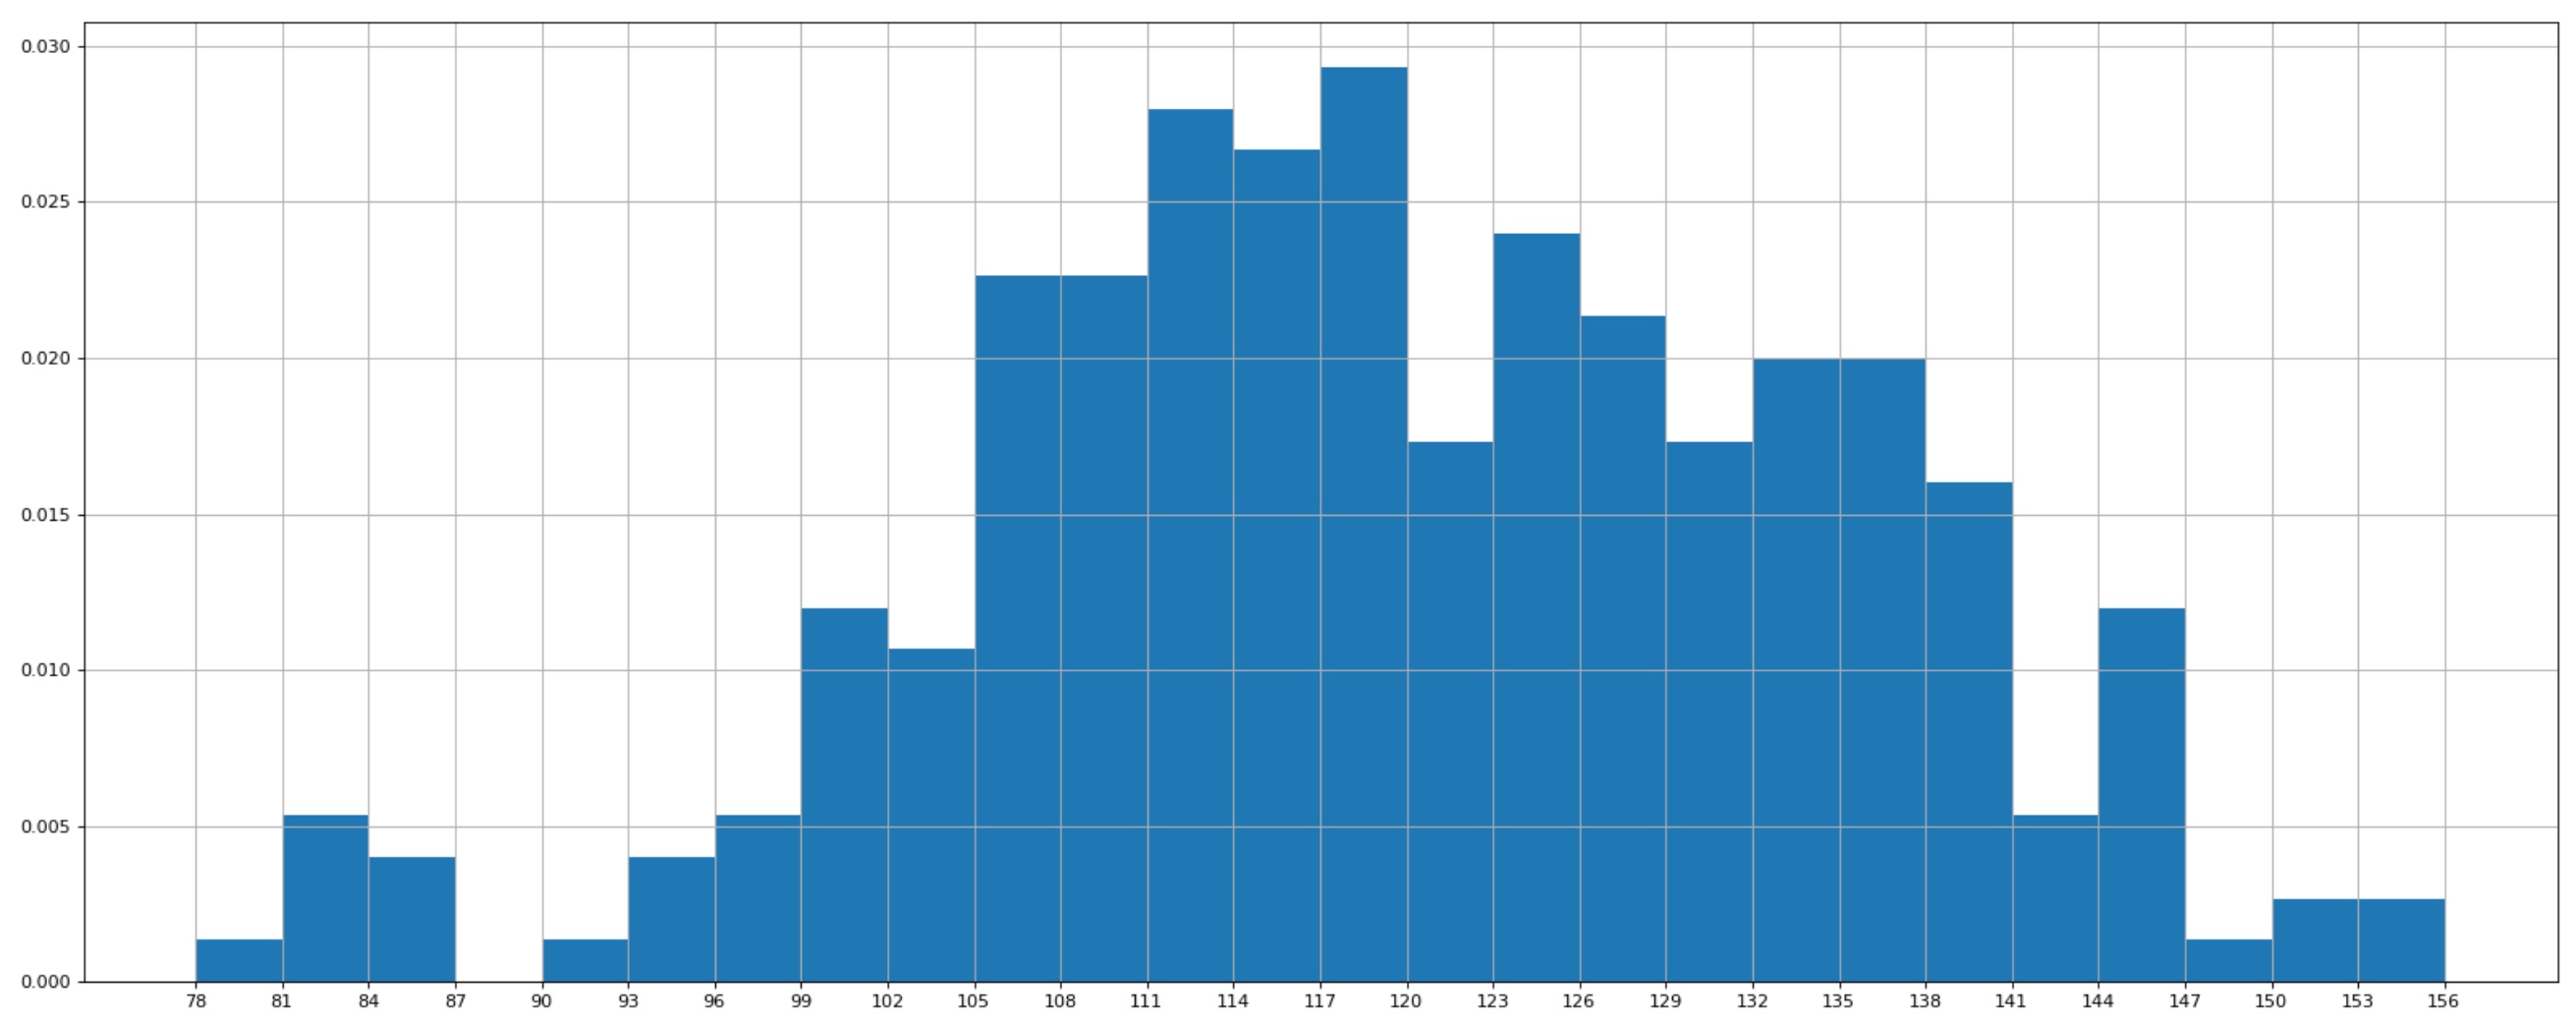
plt.hist(a,num_bins,normed=True)
#设置x轴的刻度
plt.xticks(range(min(a),max(a)+d,d))
plt.grid()
plt.show()
显示效果