一 场景分析
定位分析广泛应用,比如室外基站定位,室内蓝牙beacon定位,室内wifi探针定位等,实现方式是三点定位 Trilateration
理想情况
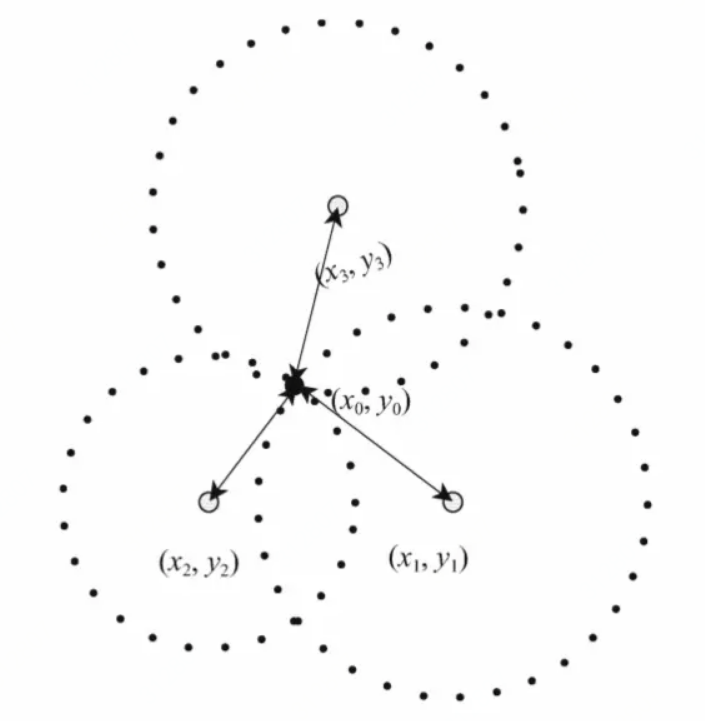
这种理想情况要求3个基站‘同时’采集‘准确’的距离信息,
实际情况
- 3个基站采集数据的时间是分开的;
- 采集数据的距离不准确;
解决方法是:
- 增加基站数量,即增加采集数据的密度和数量;
- 不采用一个时间点的数据,而采用一个时间段的数据计算,比如5s内可能只有1个基站的数据,但是30s内可能会有超过3个基站的数据;
- 在误差范围内,采用数学方法迭代收敛,找出概率上最有可能的未知点的坐标;
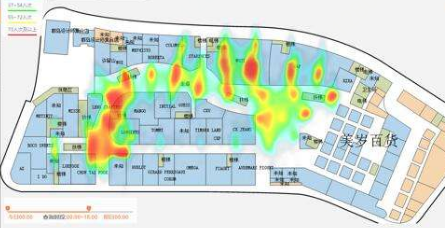
得到未知点坐标之后再结合时间可以做更多应用:轨迹图,热力图等,比如
二 问题抽象
已知条件
- n个点位置坐标:(x1, y1), (x2, y2), (x3, y3), ..., (xn, yn)
- 未知点到n个点距离:d1, d2, d3, ..., dn
求解
- 未知点位置坐标(x, y)
方程
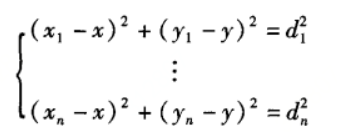
解法
上面的方程是2次方程,首先尝试将次数降低,用方程组中第n-1个方程减去第n个方程后,方程转换为1次方程
得到1次方程(线性方程)之后,利用最小二乘法(最小平方法)求得最优解,即最小二乘解;
问题模型简化
(x1, y1, d1)
(x2, y2, d2)
...
(xn, yn, dn)
->
(x, y)
三 统计示例
输入
(1.0, 1.0, 1.0)
(2.0, 0.0, 1.0)
(2.0, 2.0, 1.0)
输出
(2.0,1.0)
四 代码实现
scala核心代码
scala
  /**
    * @param datas Array(x_coordinates, y_coordinates, distance)
    * @return (x_coordinates, y_coordinates)
    */
  def detect(datas : Array[(Double, Double, Double)]) : (Double, Double) = {
    if (datas == null || datas.isEmpty) (0, 0)
    else if (datas.length == 1) return (datas.head._1, datas.head._2)
    else if (datas.length == 2) return ((datas.head._1 + datas.last._1) / 2, (datas.head._2 + datas.last._2) / 2)
    else {
      var data = Array[Array[Double]]()
      //X + (y_1 - y_i)/(x_1 - x_i)Y = (sq(d_i) - sq(d_1) + sq(x_1) + sq(y_1) - sq(x_i) - sq(y_i))/2(x_1 - x_i)
      for (i <- 1 to (datas.length - 1)) data = data :+ Array((datas.head._2 - datas.apply(i)._2) / (datas.head._1 - datas.apply(i)._1), (Math.pow(datas.apply(i)._3, 2) - Math.pow(datas.head._3, 2) + Math.pow(datas.head._1, 2) + Math.pow(datas.head._2, 2) - Math.pow(datas.apply(i)._1, 2) - Math.pow(datas.apply(i)._2, 2))  / 2 / (datas.head._1 - datas.apply(i)._1))
      val regression = new SimpleRegression
      regression.addData(data)
      (regression.getIntercept, regression.getSlope)
    }
  }
测试运行
      println(detect(Array((1.0, 1.0, 1.0))))
      println(detect(Array((1.0, 1.0, 1.0), (2.0, 2.0, 1.0))))
      println(detect(Array((1.0, 1.0, 1.0), (2.0, 0.0, 1.0), (2.0, 2.0, 1.0))))
      println(detect(Array((1.0, 1.0, 1.0), (2.0, 0.0, 1.0), (2.0, 3.0, 1.0))))
      println(detect(Array((1.0, 1.0, 1.0), (2.0, 0.0, 1.0), (2.0, 3.0, 1.0), (2.0, 3.0, 1.0), (20.0, 30.0, 1.0))))
输出
(1.0,1.0)
(1.5,1.5)
(2.0,1.0)
(2.5,1.5)
(7.728915662650602,3.3674698795180724)
五 半径图效果
实际数据的半径图示例:
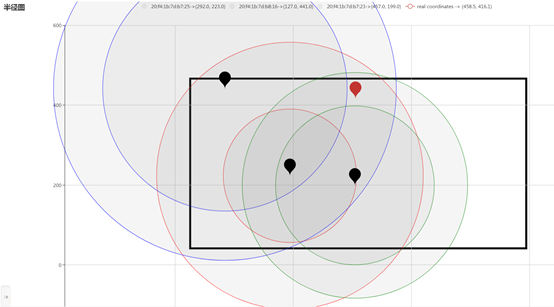
半径图中黑色点表示基站位置,每个基站都有一个或两个圆圈,其中两个圆圈使用数据里的最大距离和最小距离绘制的;红色点表示根据算法定位出来的设备位置;