版权声明:【show me the code ,change the world】 https://blog.csdn.net/yangshangwei/article/details/85270388
文章目录
概述
Hystrix除了提供容错外,还提供了功能近乎实时的监控。HystrixCommand和HystrixObservableCommand在执行时,会生成执行结果和运行指标。
监控Hystrix
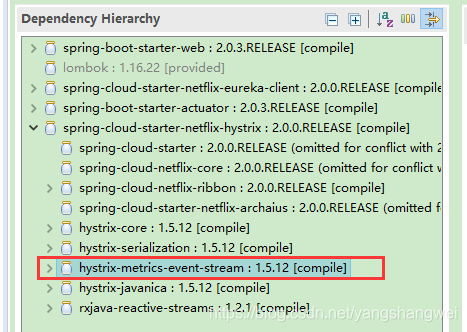
Hystrix的hystrix-metrics-event-stream模块 将监控信息以text/event-stream的格式暴露给外部系统。添加 spring-cloud-starter-netflix-hystrix依赖后,我们看下pom的依赖关系,如下图,可以知道 spring-cloud-starter-netflix-hystrix已经包含了该模块。
这样的话,只需要添加spring-boot-starter-actuator即可,就可以使用 /actuator/hystrix.stream端点来获取Hystrix的监控信息了。
步骤
我们用 上一篇 Spring Cloud【Finchley】-08使用Hystrix实现容错中的示例来演示下如何监控Hystrix. 该工程已经能够满足我们上面说的监控Hystrix的条件
Step1 添加spring-cloud-starter-netflix-hystrix依赖
- spring-cloud-starter-netflix-hystrix(包含了hystrix-metrics-event-stream)
Step2 添加spring-boot-starter-actuator依赖
- spring-boot-starter-actuator
Step3 application.yml开启监控端点
- application.yml 中 配置信息开启了所有的监控端点
#actuator  启用所有的监控端点 “*”号代表启用所有的监控端点,可以单独启用,例如,health,info,metrics
#  spring boot 升为 2.0 后,为了安全,默认 Actuator 只暴露了2个端点,heath 和 info,继续
# 访问  http://192.168.1.103:7902/actuator/metrics
management:
  endpoints:
    web:
      exposure:
        include: "*"
  endpoint:
      health:
        show-details: ALWAYS
Step4 测试
- 启动microservice-discovery-eureka,注册中心
- 启动micorservice-provider-user,服务提供者
- 启动micorservice-consumer-movie-ribbon-hystrix,服务消费者,整合了Hystrix , 端口 7902
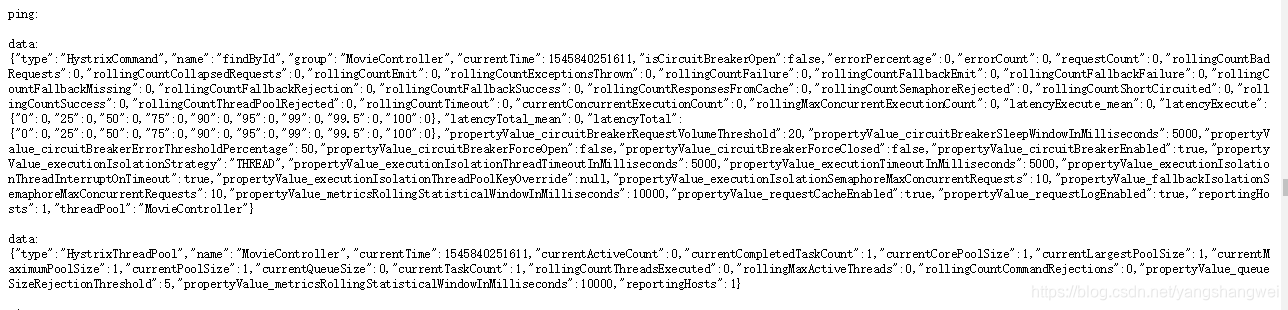
- 访问 http://localhost:7902/actuator/hystrix.stream ,如下

一直处于ping 请求状态,是因为micorservice-consumer-movie-ribbon-hystrix中注解了@HystrixCommand的方法还未被执行,没有产生监控数据,
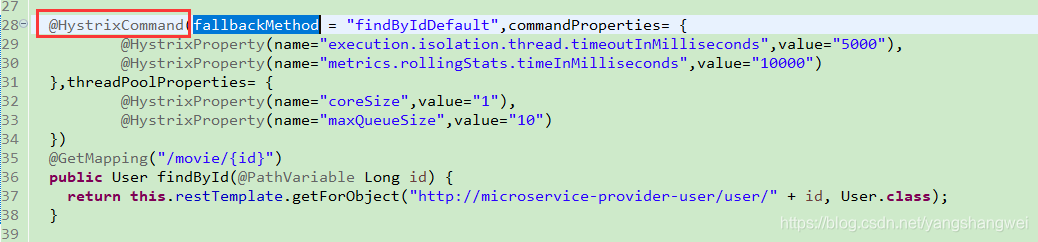
- 访问@HystrixCommand注解标注的方法 ,请求 http://localhost:7902/movie/4 ,重新去 http://localhost:7902/actuator/hystrix.stream 观察下,如下
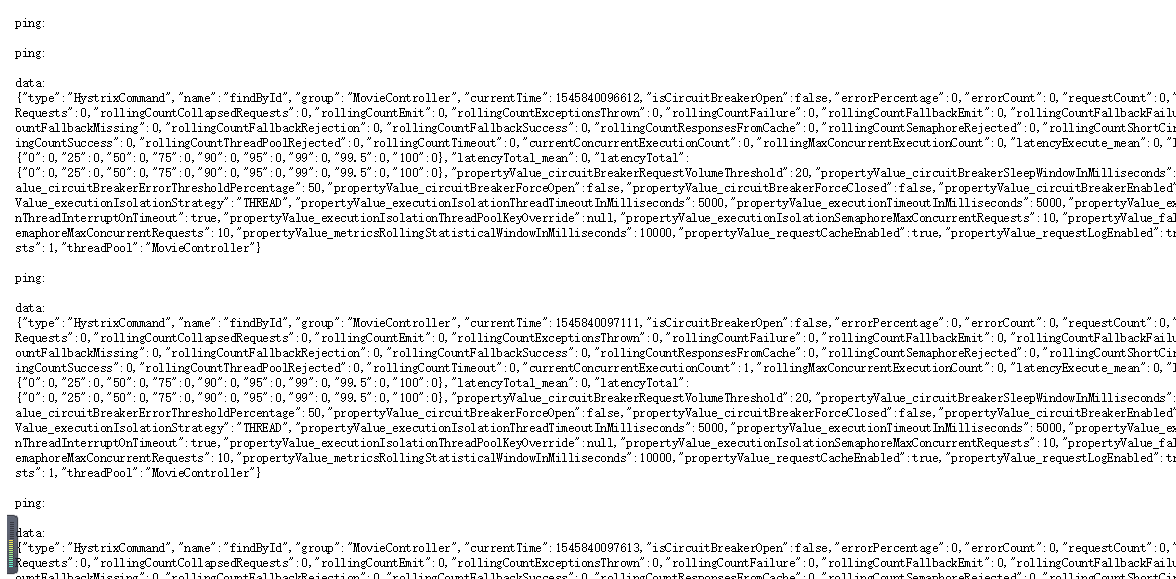
重复出现类似的内容,是因为系统会不断的刷新以便可以获取实时的监控数据,包括HystrixCommand的名称、group名称、断路器名称、错误率、错误数等