文章目录
前言
发现Python中有很多值得研究的问题,但是时间不太多。所以就在这里简要记录一下。
1 python的编码解码
[1] Python String encode(). https://www.programiz.com/python-programming/methods/string/encode
Since Python 3.0, strings are stored as Unicode, i.e. each character in the string is represented by a code point. So, each string is just a sequence of Unicode code points.
告诉我们python里面的字符串默认都是Unicode编码格式。
For efficient storage of these strings, the sequence of code points are converted into set of bytes. The process is known as encoding.
There are various encodings present which treats a string differently. The popular encodings being utf-8, ascii, etc.
Using string’s encode() method, you can convert unicoded strings into any encodings supported by Python. By default, Python uses utf-8 encoding.
还可参考:[1.2] python中的encode()和decode()函数. https://blog.csdn.net/m0_38080253/article/details/78841280
python 查看当前字符串的编码格式可以使用chardet.detect方法,参考:
[1.3] python 怎么查看当前字符串的编码格式。 https://zhidao.baidu.com/question/1887471408784212548.html
#coding:utf-8
import chardet

for i in ['abc123','中国']:
    print i,chardet.detect(i)
2 python中的\ (反斜杠)
[2] Python中的正斜杠与反斜杠 https://www.cnblogs.com/caiwenjing/p/8267023.html
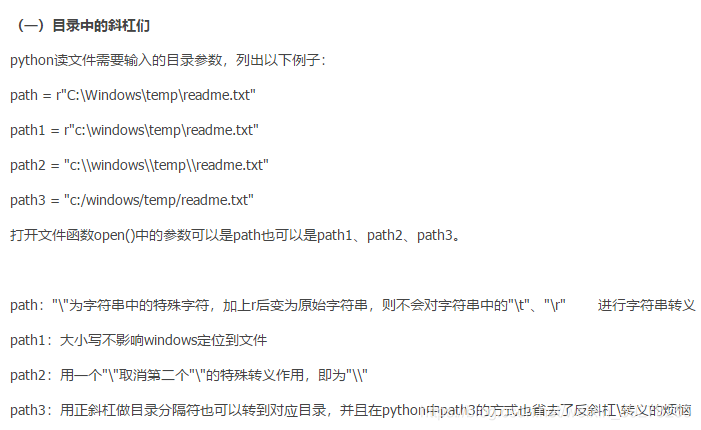
很经典。
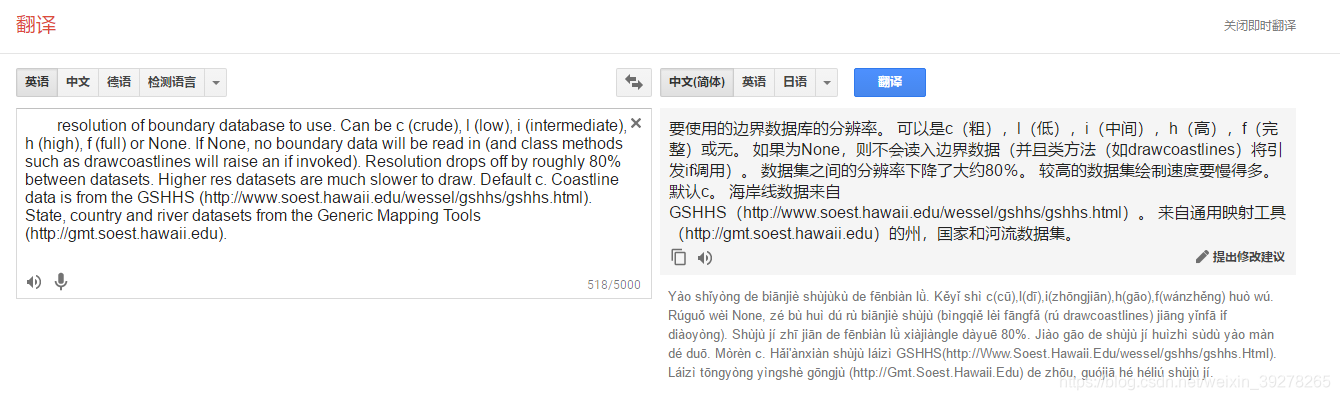
3 basemap 参数
参数请参考这里,非常全:
[3] matplotlib basemap toolkit. https://matplotlib.org/basemap/api/basemap_api.html#module-mpl_toolkits.basemap
看不懂英文可以直接复制到谷歌翻译中,很准。
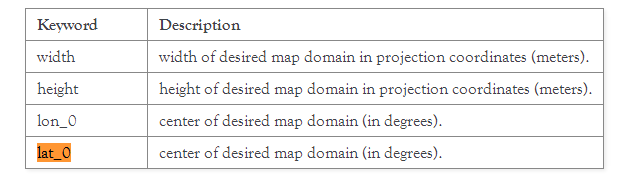
比如resolution 参数:
lat_0: center of desired map domain (in degrees).
lon_0: center of desired map domain (in degrees).
里面有一句很重要的话:
Calling a Basemap class instance with the arguments lon, lat will convert lon/lat (in degrees) to x/y map projection coordinates (in meters). If optional keyword inverse is True (default is False), the inverse transformation from x/y to lon/lat is performed.
意思就是:在调用 Basemap() 实例化一个Basemap对象之后,再calling 这个对象 with the arguments:lon和lat (单位是度°),分别转成成地图投影上的坐标 x和y (单位是米m)
我想这个就是以下代码片段这样写的原因:
map = Basemap(projection='robin', lon_0=0, resolution='c')
# 北京的纬度和经度
latitudeBeijing  = 39.91
longitudeBeijing = 116.39
# 将经纬度转换为图像中的位置(注意参数分别是经度、纬度)
x, y = map(longitudeBeijing, latitudeBeijing)
4 让你设置的环境变量立刻生效(无须注销或重启)
[4] windows下更新环境变量不需要重启系统快速生效的方法(原理篇). https://blog.csdn.net/u010770041/article/details/49915089
这个确实有意思。
我之前设置了一个PROJ_LIB变量,但是我重启spyder之后还是不行。
然后我在cmd中 echo %PROJ_LIB%
之后关闭spyder再打开,就不会报错了,很有意思。
5 pyplot中的figure和subplot函数
[5] How do I get multiple subplots in matplotlib? https://stackoverflow.com/questions/31726643/how-do-i-get-multiple-subplots-in-matplotlib
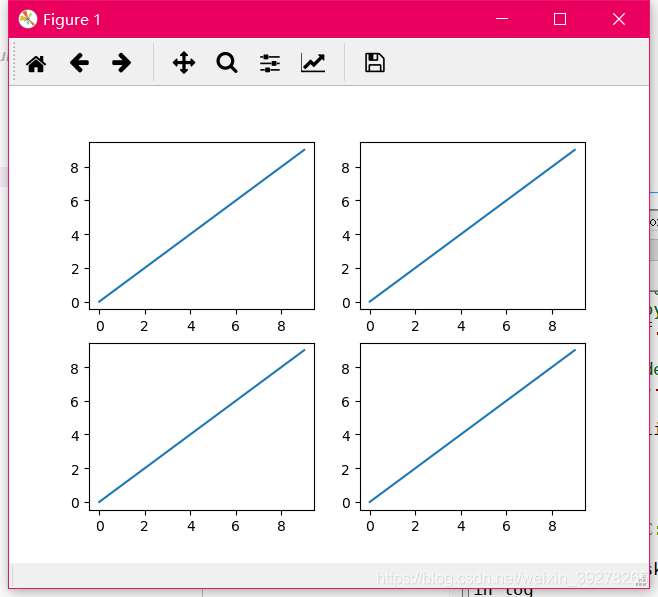
这里讲述了在python下用pyplot画出四个子图的各种方式,很有意思:
1)直接使用subplots函数定义四个子图
import matplotlib.pyplot as plt

x = range(10)
y = range(10)

fig, ax = plt.subplots(nrows=2, ncols=2)  # nrows和ncols是subplots函数的参数,表明几行几列

for row in ax:
    for col in row:
        col.plot(x, y)

plt.show()
2)使用subplot函数分别定义子图(有点像MATLAB)
fig = plt.figure()

plt.subplot(2, 2, 1)
plt.plot(x, y)

plt.subplot(2, 2, 2)
plt.plot(x, y)

plt.subplot(2, 2, 3)
plt.plot(x, y)

plt.subplot(2, 2, 4)
plt.plot(x, y)

plt.show()
3)
import matplotlib.pyplot as plt

fig = plt.figure()
axes = fig.subplots(nrows=2, ncols=2)

plt.show()
4)
import matplotlib.pyplot as plt

fig, ax = plt.subplots(2, 2)

ax[0, 0].plot(range(10), 'r') #row=0, col=0
ax[1, 0].plot(range(10), 'b') #row=1, col=0
ax[0, 1].plot(range(10), 'g') #row=0, col=1
ax[1, 1].plot(range(10), 'k') #row=1, col=1
plt.show()
5)
import matplotlib.pyplot as plt
fig, (ax1, ax2, ax3, ax4) = plt.subplots(2, 2, sharex=True, sharey=True)
ax1.plot(range(10), 'r')
ax2.plot(range(10), 'b')
ax3.plot(range(10), 'g')
ax4.plot(range(10), 'k')
plt.show()
注意:
参考:[5.2] https://matplotlib.org/api/pyplot_api.html#matplotlib.pyplot.subplots
subplots函数全名叫做:
matplotlib.pyplot.subplots( nrows=1, ncols=1, sharex=False, sharey=False, squeeze=True, subplot_kw=None, gridspec_kw=None, **fig_kw )
里面很多参数都是默认的。
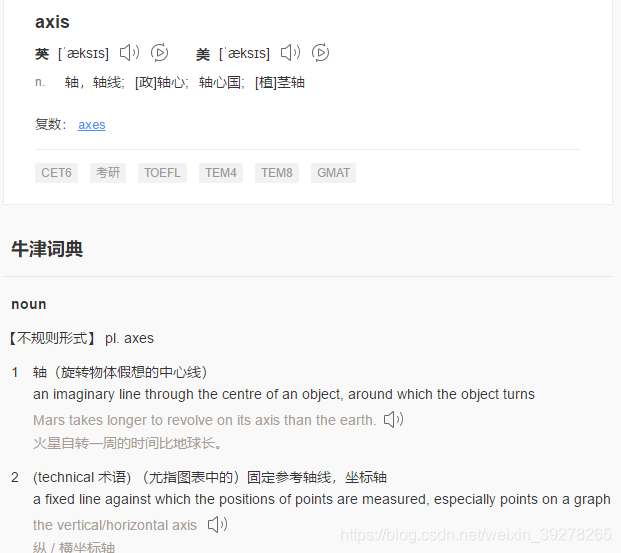
该函数返回两个值:

其中,fig表示figure,ax表示axes(是axis的复数形式,如下。是坐标轴的意思)。
对于figure,这里是figure函数的操作:
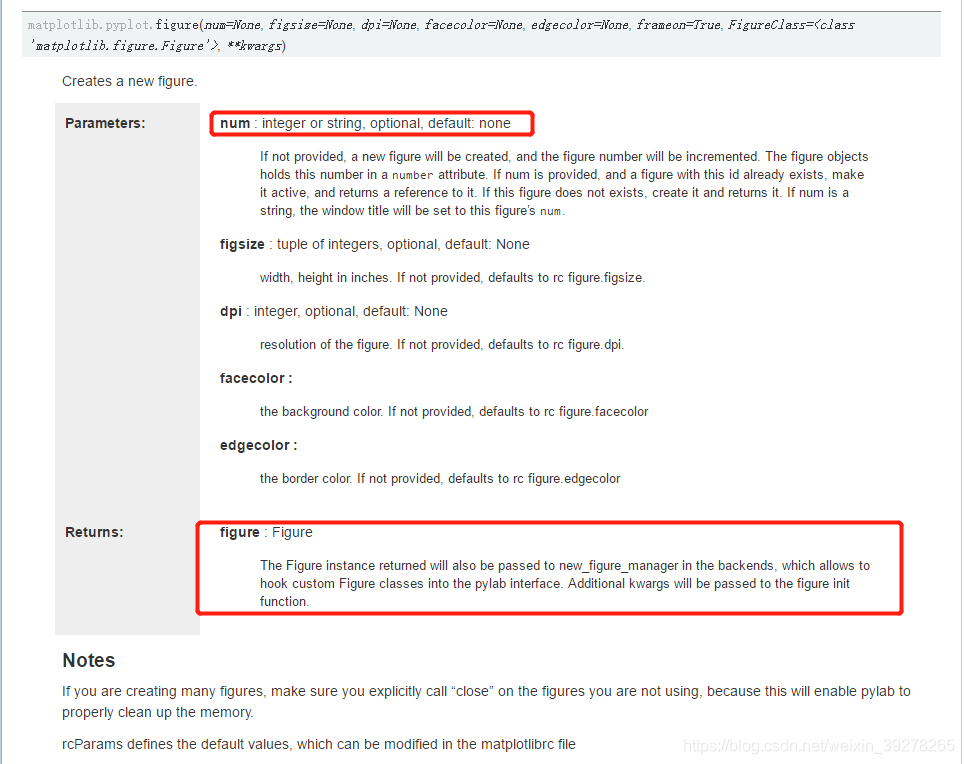
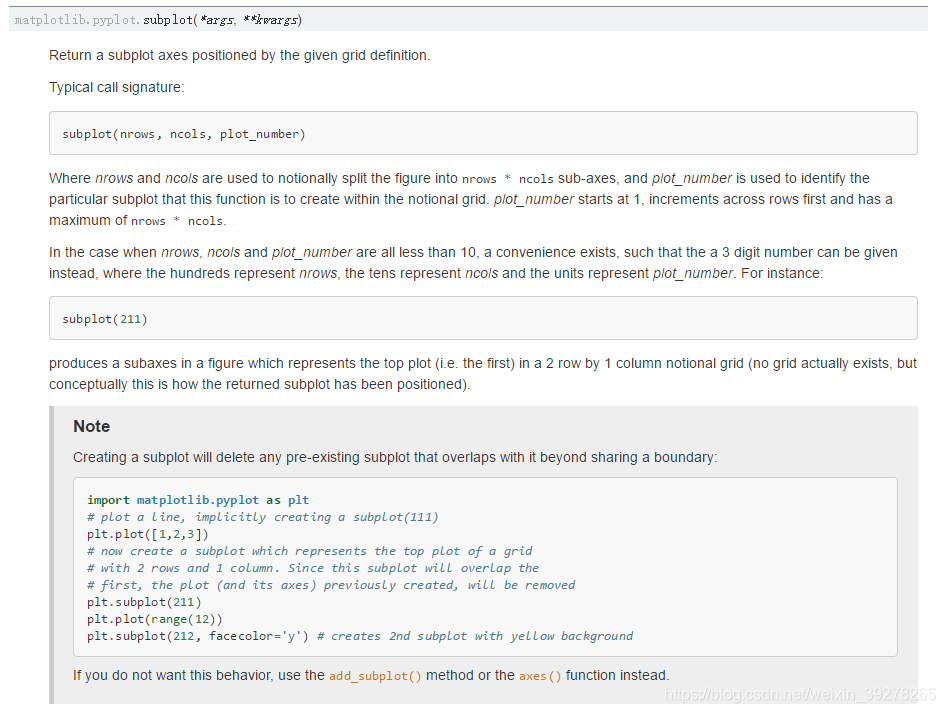
这里还支持subplot函数: [5.3] https://matplotlib.org/api/pyplot_api.html#matplotlib.pyplot.figure
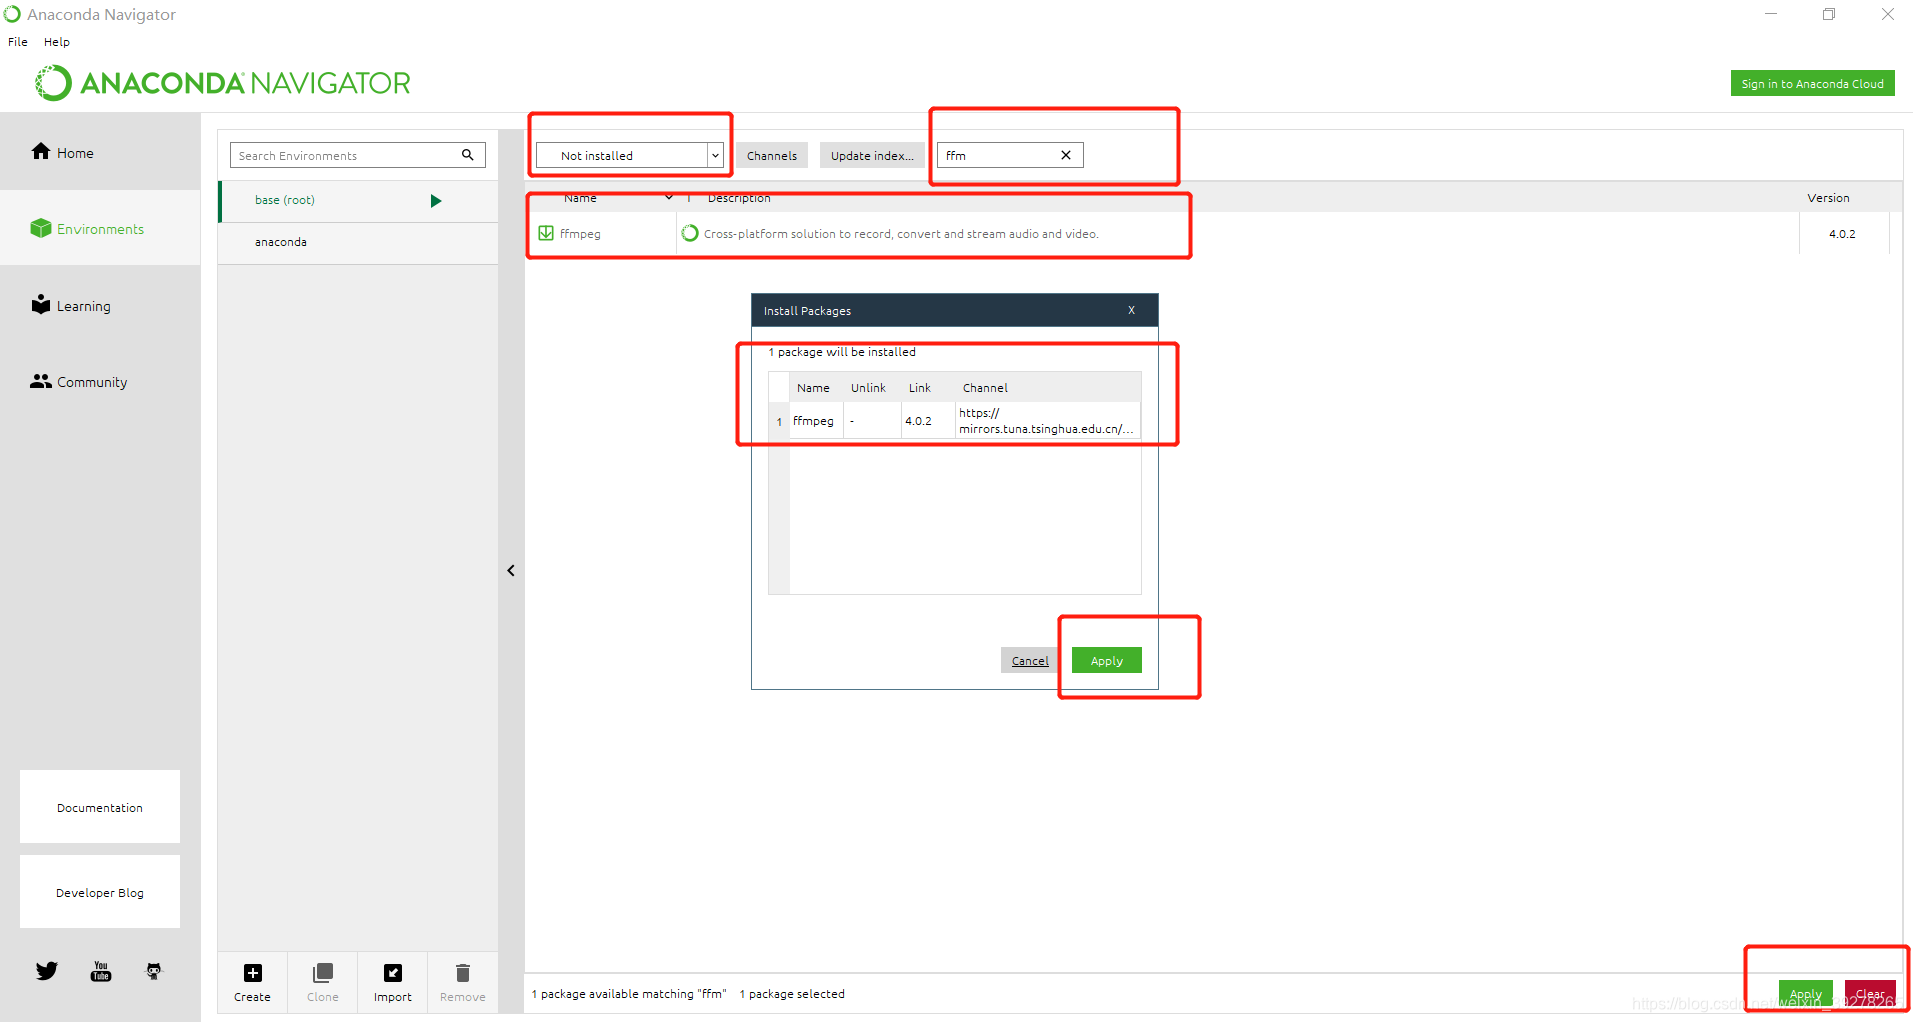
6 anaconda 下安装ffmpeg
直接在navigator里面搜索安装即可。
然而,,,似乎这并不是python里面的一个模块,而是系统的一个软件,所以我在spyder里面
import ffmpeg
结果是:
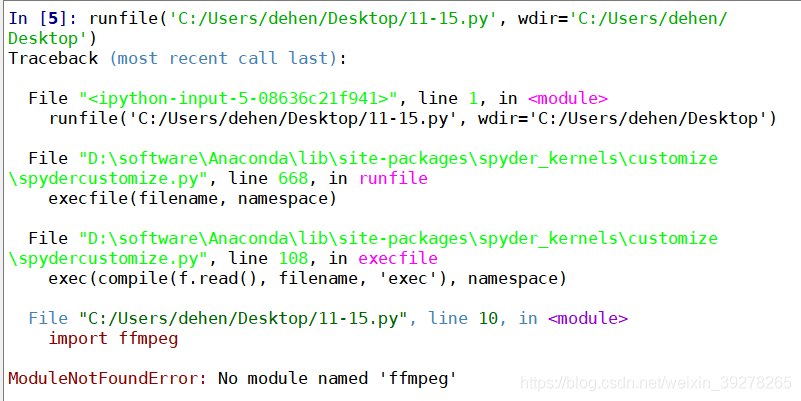
但是打开cmd,输入ffmpeg -version,却能够看到相应的版本信息:
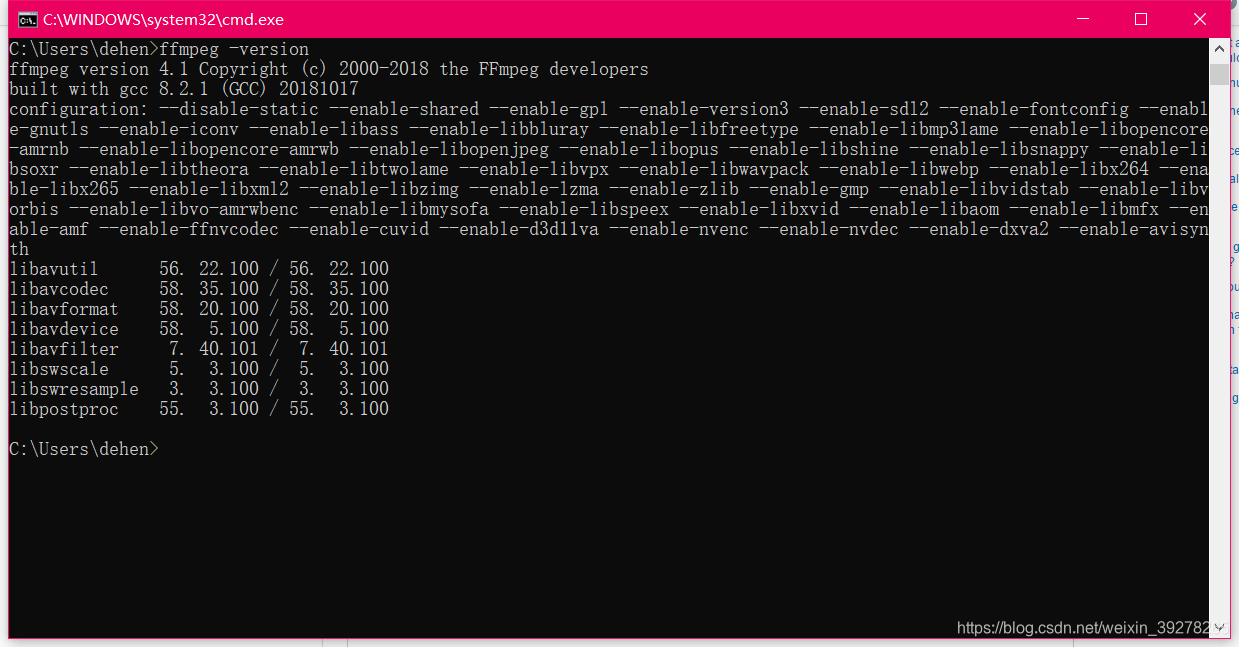
很神奇。
7. Spyder代码补全设置
[7] 代码提示功能和spyder 代码自动补齐设置方式. https://blog.csdn.net/pursuit_zhangyu/article/details/79622150
1)toors->preferences->IPython console->advanced Settings 选中Use the greedy completer
2)也是在这个greedy completer的下面,Autocall调至Full。
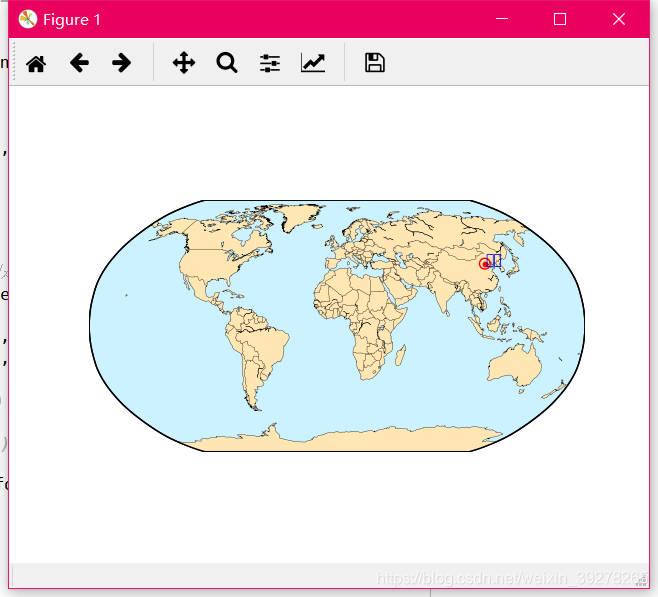
8. 怎么利用Basemap画出地球,并显示首都北京
from mpl_toolkits.basemap import Basemap
import matplotlib.pyplot as plt # 先要import进来

map = Basemap(projection='robin', lon_0=0, resolution='c')   #构件Basemap对象实例
map.drawcoastlines(linewidth=0.25)               #绘制海岸线
map.drawcountries(linewidth=0.25)                #绘制国界线
map.drawmapboundary(fill_color=(0.8, 0.95, 1.0)) #draw map boundary 画出地图边界,并填充背景(海洋)
map.fillcontinents(color=(1,0.9,0.7),lake_color=(0.8, 0.95, 1.0),zorder=0) # 明确大陆和湖泊的颜色

x, y = map(116.39, 39.91) # 将北京所在的经度(前者)和纬度(后者),转化为map中的坐标。

#用点和圈标出北京
map.scatter(x, y, s = 10, marker='o', color='r') # 绘制实心红点
map.scatter(x, y, s = 60, marker='o', color='None', edgecolor='r') # 空心红圈

plt.text(x, y, '北京', color = 'b', fontsize=10)  # 标记“北京”

plt.show()
但是这个时候并不能显示“北京”这两个中文字符(变成了方框)。
参考:[8] 关于python idle不能成功运行matplotlib中函数的解答。
https://blog.csdn.net/weixin_39278265/article/details/83540297
即在程序的开头加上以下几行:
from pylab import mpl
mpl.rcParams['font.sans-serif'] = ['kaiti'] # 指定字体为楷体
在运行即可成功显示“北京”。
9. python 的 FuncAnimation函数
参考[9] matplotlib.animation.FuncAnimation
https://matplotlib.org/api/_as_gen/matplotlib.animation.FuncAnimation.html#matplotlib.animation.FuncAnimation
[9-1] python学习之matplotlib绘制动图(FuncAnimation()参数)
https://www.cnblogs.com/zhouzhe-blog/p/9614360.html
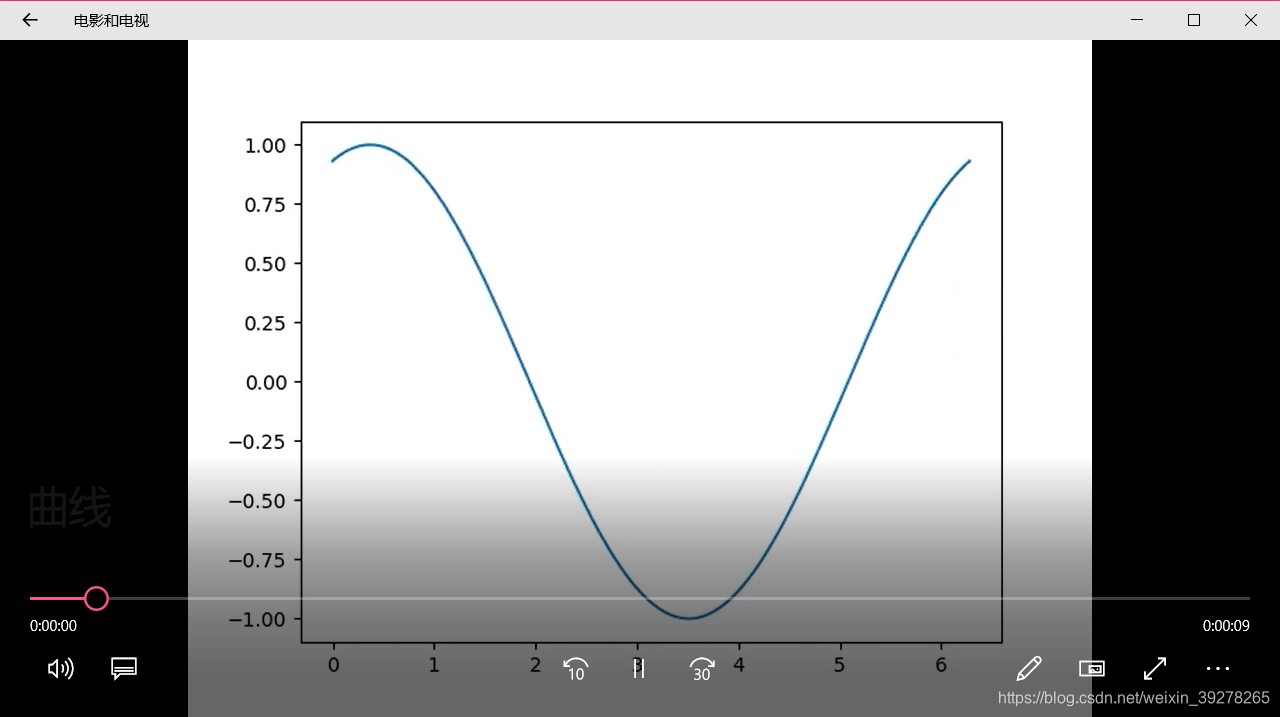
且这里给出一段很基础的代码,供参考:
[9-2] animation example code: simple_anim.py
https://matplotlib.org/examples/animation/simple_anim.html
import numpy as np
import matplotlib.pyplot as plt
import matplotlib.animation as animation

fig, ax = plt.subplots()

x = np.arange(0, 2*np.pi, 0.01)
line, = ax.plot(x, np.sin(x))


def animate(i):
    line.set_ydata(np.sin(x + i/10.0))  # update the data
    return line,


# Init only required for blitting to give a clean slate.
def init():
    line.set_ydata(np.ma.array(x, mask=True))
    return line,

ani = animation.FuncAnimation(fig, animate, np.arange(1, 200), init_func=init,
                              interval=25, blit=True)
plt.show()
运行效果: