版权声明:本文为博主原创文章,未经博主允许不得转载。 https://blog.csdn.net/qq_28018283/article/details/82983673
awk 方式
本文主要用这种方式实现 统计 access.log 超过 1s 的记录。
思路:先用 awk 将每天切割的 nginx 日志生成自定义的分析结果文件 ,由 python 脚本处理,导入mysql :记录日期,慢Url 路径,慢Url 最短时间,最差时间,访问次数 ,是否修复 ,修复日期等,最后由前端进行展示。
按天切割 Nginx 日志
这里为了每天夜里只分析当天生成的nginx日志,我们可以把nginx按天切割备份。日常环境中,我们也可以使用这种方法,按天、按月、按年lai 备份和切割日志,方便后期进行数据过滤或删除。
#/bin/bash
nginxLog="/usr/local/nginx/logs/access.log"
logBakFile="/usr/local/nginx/logs/"$(date "+%F")/"access.log"

if [ ! -d ${logBakFile%/*} ]
then
    mkdir -p ${logBakFile%/*}
fi
mv $nginxLog $logBakFile 2>&1 >/dev/null
kill -USR1 `cat /usr/local/nginx/logs/nginx.pid`
#切割nginx日志
59 23 * * * bash /root/auto-sh/nginxErrLog_logrotate.sh
59 22 * * * bash /root/auto-sh/nginxAccLog_logrotate.sh
这样,我们就得到了,这样的Nginx切割的日志
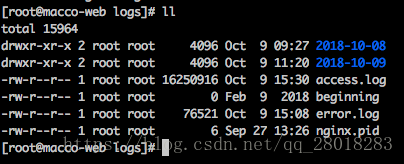
[root@macco-web 2018-10-08]# ls
access.log  error.log
这里我们对 access.log 进行处理
附上 nginx.conf 日志格式部分的配置:
log_format main "$remote_addr  $http_x_readtime [$time_local] \
"$request_method http://$host$request_uri\" $status $body_bytes_sent \"$http_referer\" \"$upstream_addr\" \
"$http_user_agent\" \"$upstream_response_time\" \"$request_time\" ";
Awk 脚本
#分析nginx日志 需要去除 每天备份的log“” 存储到1.txt
cat access.log| awk '{print $(NF)}' | awk -F "\"" '{print $2}'>1.txt
#将 1.txt的结果拼接到 access.log   存放到log.txt
paste -d " "  access.log  1.txt > log.txt
# 从 log.txt 选取想要分析的参数存放到最终的文件中,限制选取 $request_time >1 的
cat log.txt |awk '($NF>1 ){print $3 " " $5 " "  $6 " " $11 " " $NF}'>/public/nginxStatic.txt
访问 nginxStatic.txt 的结果:可以看到有我们选取的 http_x_readtime,$request_method,$request_uri,$http_user_agent, $request_time。

最后用 python,将数据处理分析之后存储到mysql。
附上思路代码:
import MySQLdb as mdb
from tqdm import tqdm

# 统计 access.log 超过 1S 的记录
# AWK 将每天的nginx日志 产生log ,由本脚本 导入sql,记录
# 日期,慢Url 路径,慢Url 最短时间,最差时间,访问次数 ,是否修复 ,修复日期
# 前端进行展示
# 定义日志文件路径
log_file_path = "/statics/nginxStatic.txt"
# 按行读取日志,过滤分析 存入mysql
f = open(log_file_path)
lines = f.readlines()
for line in tqdm(lines):
    # 用 " " 切分单行数据
    tmp_list =  line.split(" ")
    api_time = tmp_list[0].replace("[","")
    api_method = tmp_list[1].replace("\"","")
    api_url = tmp_list[2].replace("\"","")
    api_ua = tmp_list[3].replace("\"","")
    api_request_time = tmp_list[4].replace("\n","")
    # print(api_request_time)
    # sys.exit(0)
    is_fix = get_nginx_log(api_url)
    if is_fix:
        # 更新log的频率 ,更新sl_time
        id = is_fix[0][0]
        s_time = is_fix[0][1]
        l_time = is_fix[0][2]
        if api_request_time > s_time and api_request_time < l_time:
            update_nginx_log(id,1,api_request_time)
        elif api_request_time < s_time:
            update_nginx_log(id,2,api_request_time)
        elif api_request_time > l_time:
            update_nginx_log(id, 3, api_request_time)
    else:
        insert_nginx_log(api_time, api_url, api_ua, api_request_time,api_method)
数据表的表结构:
CREATE TABLE `nginxlog` (
  `id` int(11) unsigned NOT NULL AUTO_INCREMENT COMMENT 'log自增ID',
  `url` varchar(256) NOT NULL DEFAULT '',
  `method` varchar(20) DEFAULT NULL COMMENT '调用方法',
  `ua` varchar(128) DEFAULT NULL COMMENT 'user_agent',
  `short_time` decimal(5,2) DEFAULT '0.00' COMMENT '最短时间',
  `long_time` decimal(5,2) DEFAULT '0.00' COMMENT '最长时间',
  `is_fix` tinyint(1) unsigned DEFAULT '0' COMMENT '0未修复',
  `number` int(11) DEFAULT '1' COMMENT '访问次数',
  `create_time` varchar(128) DEFAULT '',
  `fix_time` timestamp NULL DEFAULT NULL,
  PRIMARY KEY (`id`)
) ENGINE=InnoDB AUTO_INCREMENT=37 DEFAULT CHARSET=utf8mb4;
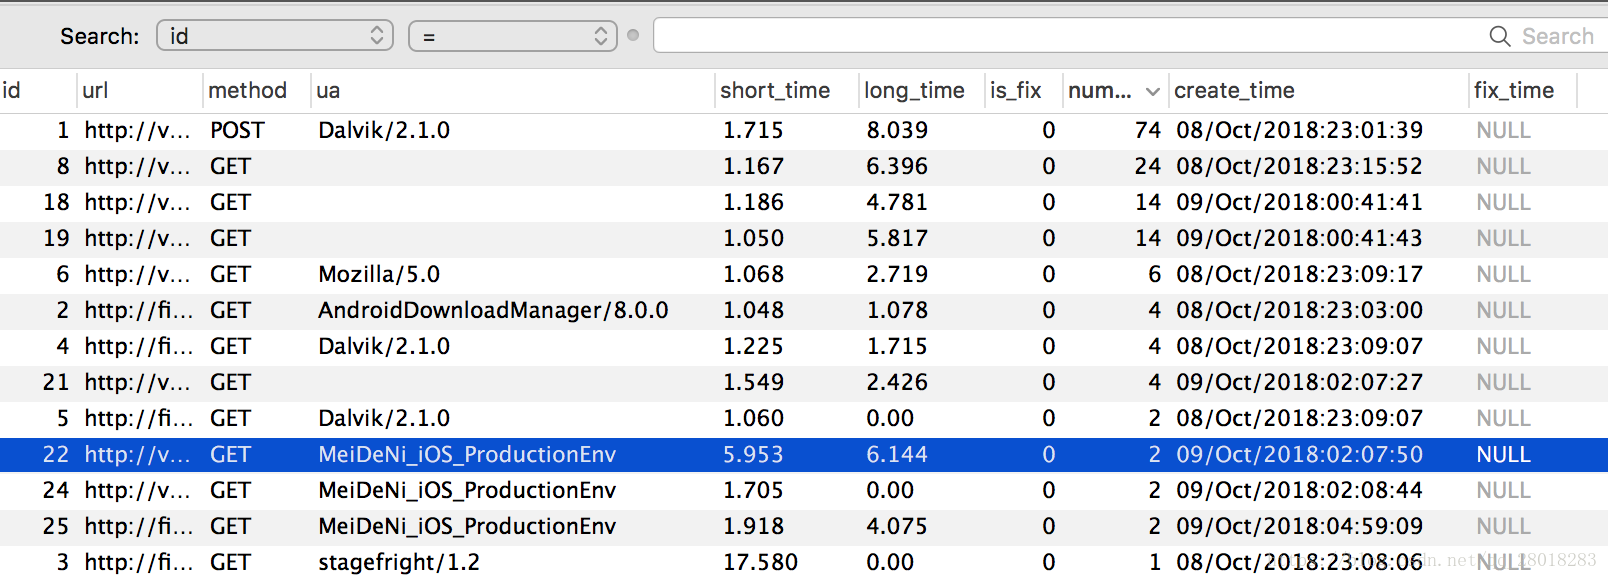
跑完之后的数据,可以很方便的给前端进行数据调用和展现了
goaccess
#安装(或源码安装)
apt-get install goaccess
$ goaccess -h
# 常用参数
-a --agent-list 启用由主机用户代理的列表。为了更快的解析,不启用该项
-d --with-output-resolver 在HTML/JSON输出中开启IP解析,会使用GeoIP来进行IP解析
-f --log-file 需要分析的日志文件路径
-p --config-file 配置文件路径
-o --output 输出格式,支持html、json、csv
-m --with-mouse 控制面板支持鼠标点击
-q --no-query-string 忽略请求的参数部分
--real-time-html 实时生成HTML报告
--daemonize 守护进程模式,--real-time-html时使用
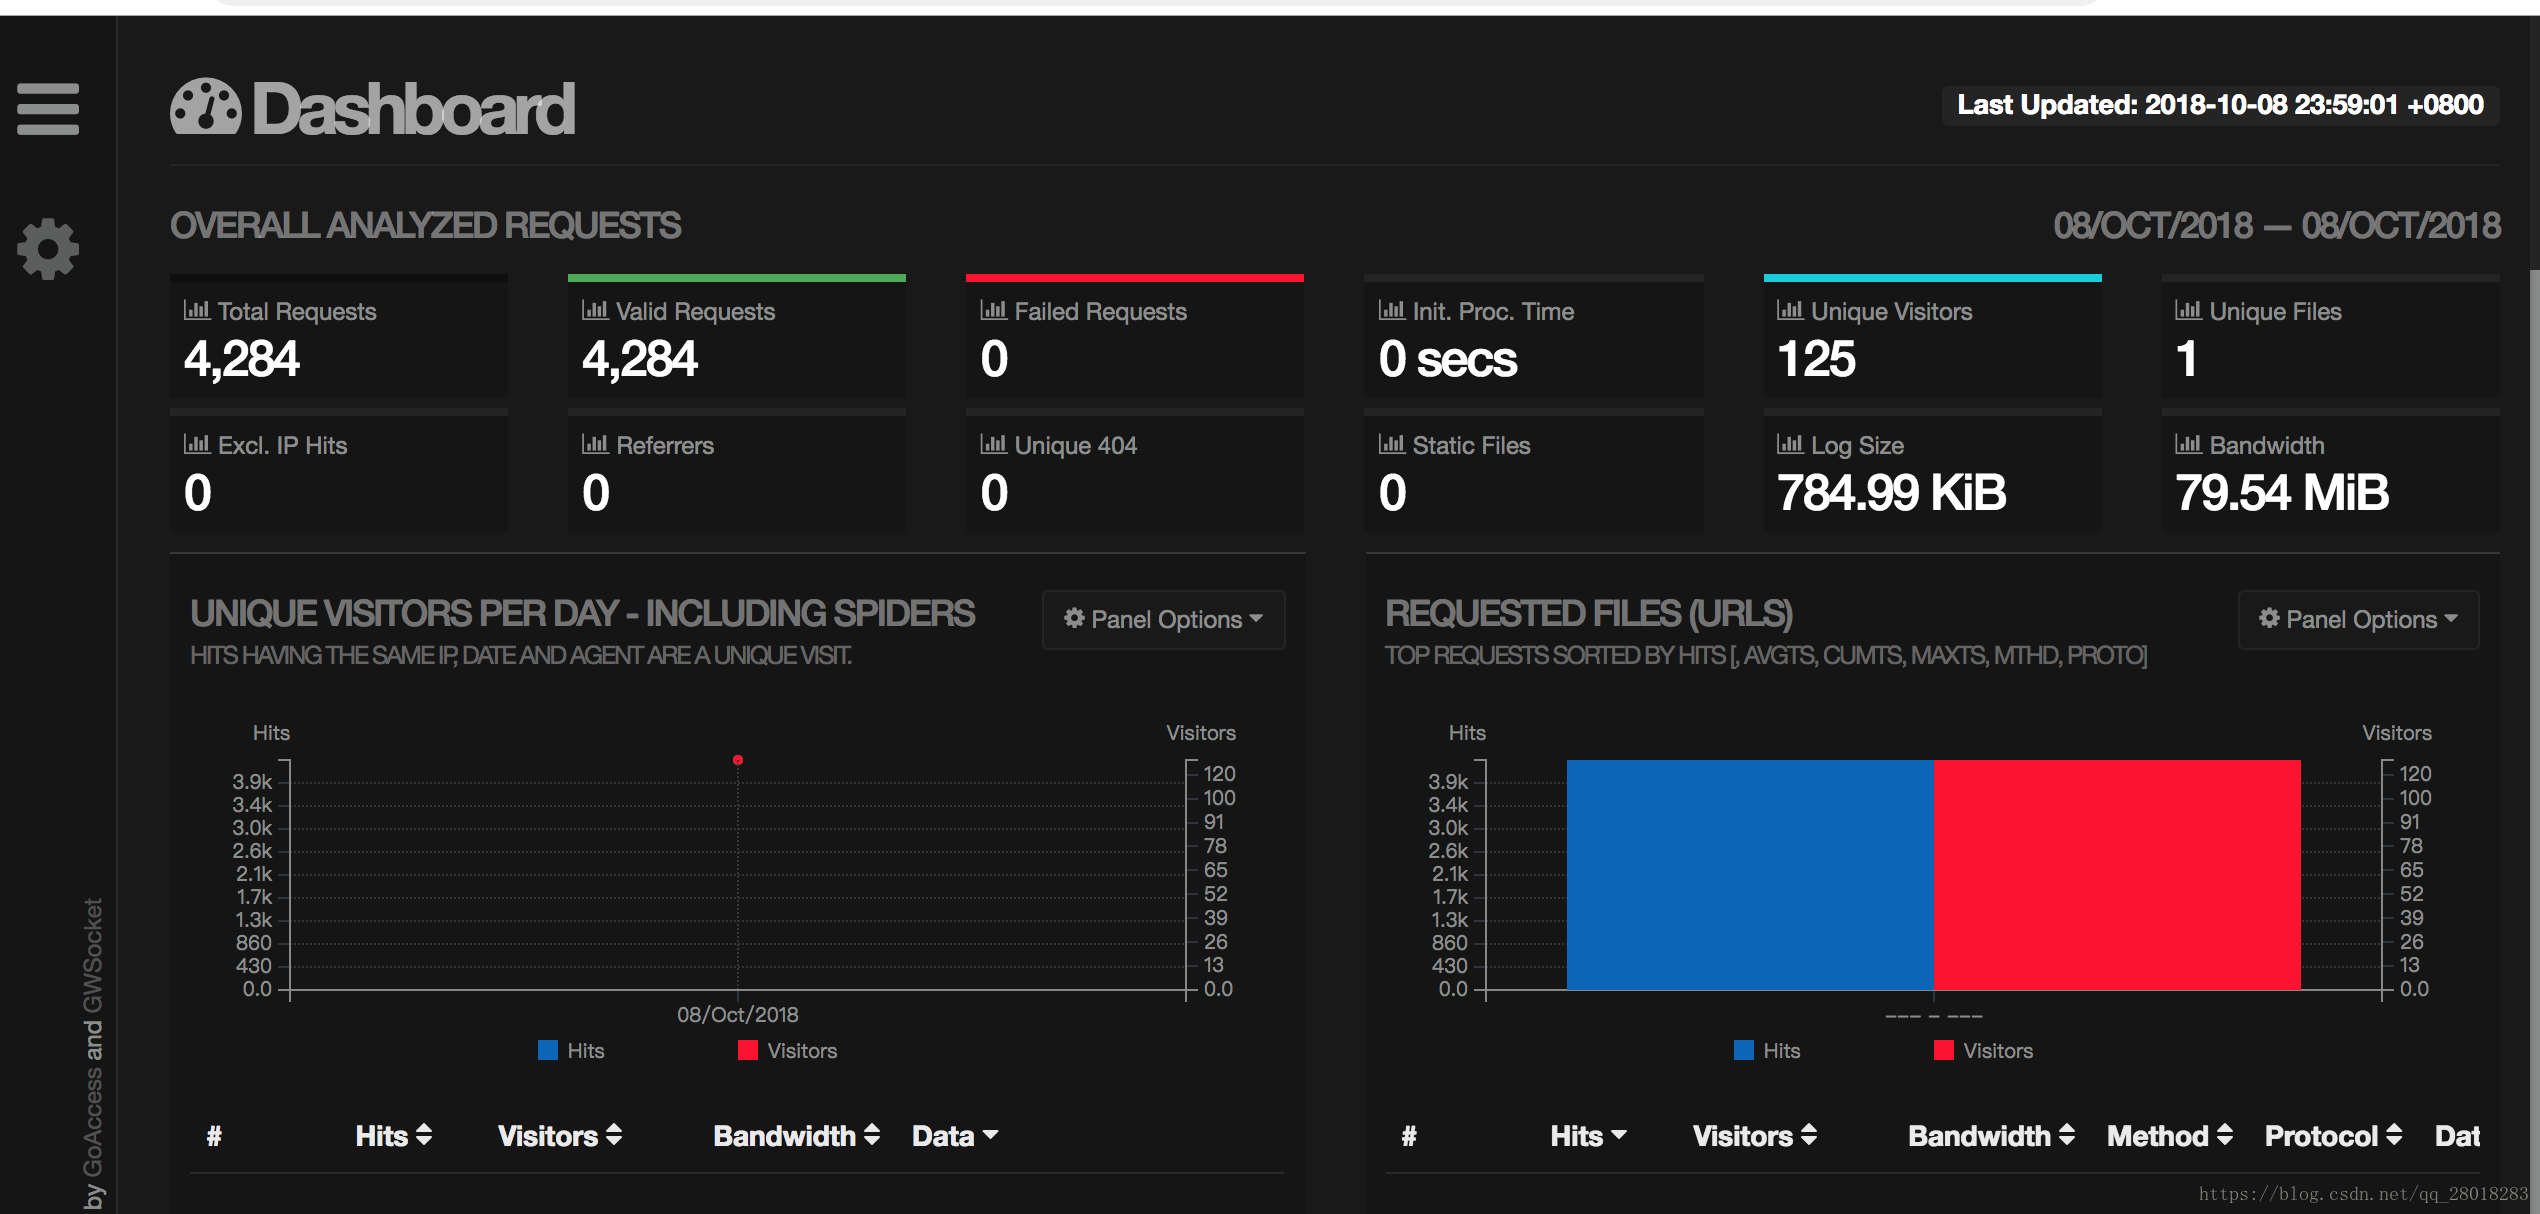
# 生成可视化html报告
goaccess -f /usr/local/nginx/logs/access.log -a > /public/report.html
生成的报告页面预览如下:能看到各种状态码的访问次数,日PV,UV等等详细信息。
这种方案还是比较简单省事的,一步就解决了上面所有的步骤 ,不过我还是选择上面的方案 ,虽然麻烦,但是有操作感,也能细节到每一步的自定义。