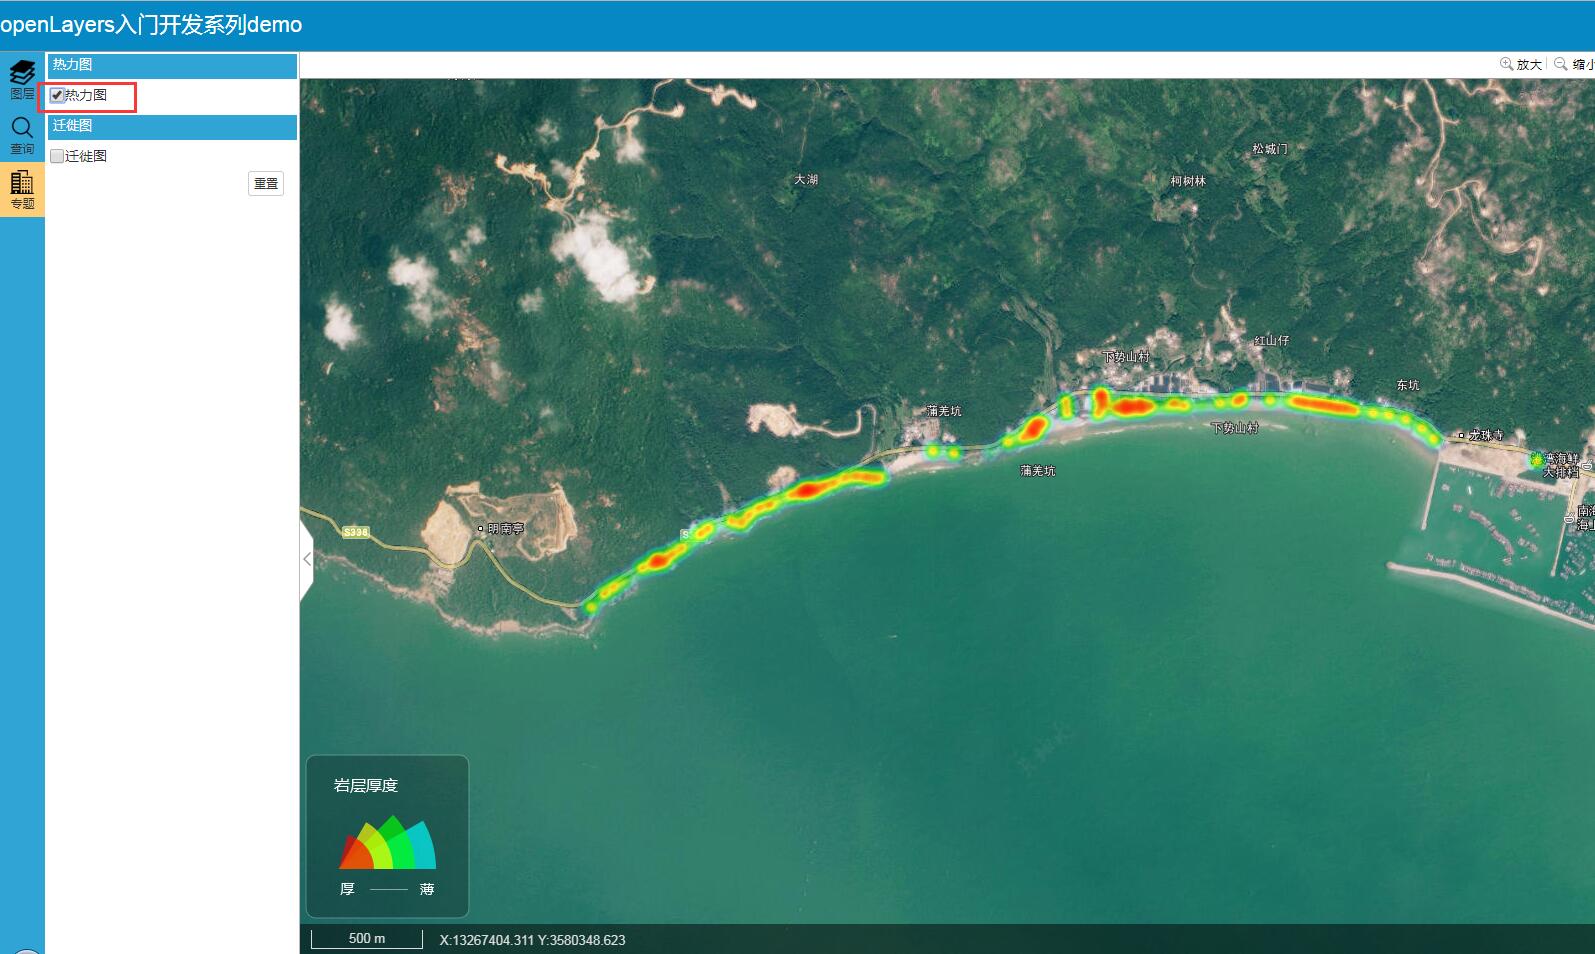
本篇的重点内容是利用openlayers实现热力图功能,效果图如下:
实现思路
- 热力图界面设计
//热力图
"<div style='height:25px;background:#30A4D5;margin-top:2px;width: 98%;margin-left: 3px;'>" +
              "<span style='margin-left:5px;font-size: 13px;color:white;'>热力图</span>" +
         "</div>" +
        '<div id="heatmapFeatureLayer" style="padding:5px;">' +
             '<div style="float:left;">' +
             '<input type="checkbox" name="heatmapFeatureLayer"  id="heatmap1" style="width: 15px;height: 15px;vertical-align: middle;margin: auto;"/>' +
             '<label style="font-weight: normal;vertical-align: middle;margin: auto;">热力图</label>' +
             '</div>' +
'</div>' +
- 热力图点击事件
//加载热力图
$("#heatmapFeatureLayer input").bind("click", function () {
            if (this.checked) {
                if(!bxmap.olHeatMap.isLoad){
                    bxmap.olHeatMap.Init(bmap);
                } else{
                    bxmap.olHeatMap.showHeatMapLayer();
                }
                //图例面板显示
                $("#map_tl").css("display","block");
                $("#map_tl>img").attr('src', getRootPath() +"js/main/olHeatMap/lend_dz.png");
                $("#map_tl>img").css("width","165px");
                $("#map_tl>img").css("height","165px");
            }
            else {
                bxmap.olHeatMap.hideHeatMapLayer();
                //图例面板隐藏
                $("#map_tl").hide();
            }
})
- 热力图初始化以及核心代码实现
Init:function(bmap){
        //加载热力图
        this.map = bmap.getMap();
        this.isLoad = true;
        this.initHeatMapLayer(dz);
    },
    /**
     * 初始化加载-热力图
     */
initHeatMapLayer:function(data){
               var num = data.features.length;
               if (num > 0) {
                   var features = new Array(num);
                   for (var i = 0; i < num; i++) {
                       var geo = data.features[i].geometry;
                       var coordinate = [geo.x, geo.y];
                           features[i] = new ol.Feature({
                           geometry: new ol.geom.Point(coordinate),
                           weight: data.features[i].attributes[field_dz]
                       });
                   }
                   this.loadHeatLayer(features);
               }
    },
    loadHeatLayer:function(features){
        var self = bxmap.olHeatMap;
        self.layer = self.createHeatMap({ features: features, radius: self.radius, gradient: self.gradient1 });//创建热力图层
        self.map.addLayer(self.layer);
        self.map.getView().on('change:resolution', self.handleHeatMap);
        //缩放至范围
        self.map.getView().fit(self.layer.getSource().getExtent(), self.map.getSize());

    },
    /**
     * 创建热力图层
     * @method createHeatmap
     * @param  features 渲染热力图的要素集
     * @return Heatmap  返回热力图层
     */
    createHeatMap:function(options){
        var vector = new ol.layer.Heatmap({
            source: new ol.source.Vector({//热力图数据来源
                features: options.features
            }),
            id: 'heat',
            extent: options.extent,
            weight: weightFunction,//设置权重,值在0-1之间
            gradient: options.gradient,
            blur: 15,//默认15
            radius: options.radius || 8//默认8
        });
        /*
         *设置权重
         */
        function weightFunction(feature) {
            var weight = feature.get('weight');
            weight = parseFloat(weight);
            //weight = parseFloat(weight) / 10;
            return weight;
        }
        return vector;
    },
……