Oracle AWR,SQL_TRACE,10046,DBMS_PROFILER 等使用
1 AWR 工具的使用及优化
1 10g默认安装
select * from dba_hist_wr_control
325518186 +00 01:00:00.000000 +07 00:00:00.000000 DEFAULT
325518186 +00 00:30:00.000000 +10 00:00:00.000000 DEFAULT
--可通过以下方法把快照收集时间间隔修改为30 分钟,保留时间从7 天修改为10 天:
---拥有dba权限的用户
begin
dbms_workload_repository.modify_snapshot_settings(interval=>30,retention=>10*24*60);
end;
/
12c
1404914474 +00 01:00:00.000000 +08 00:00:00.000000 DEFAULT 1
[oracle@oracle12c ~]$ find /u01 -name 'awrrpt.sql'
/u01/app/oracle/product/12.1.0/dbhome_1/rdbms/admin/awrrpt.sql
--再查看,采集配置已经修改。
SELECT * FROM DBA_HIST_WR_CONTROL;
2 使用
@/u01/app/oracle/product/10.2.0/db_1/rdbms/admin/awrrpt.sql
[root@localhost admin]# pwd
/u01/app/oracle/product/10.2.0/db_1/rdbms/admin
[root@localhost admin]# su - oracle
回车生成默认的html格式,或者输入txt格式
回车默认采样全天的快照,输入1表示只显示当天
快照开始点 snap_id, 快照结束点snap_id,分别有对应的时间
产生报表文件,默认awrrpt_1_1_3.html的报表
file:当前目录下
/u01/app/oracle/product/10.2.0/db_1/rdbms/admin/awe_20131126.html
[root@localhost u01]# find / -name awrrpt_1_6038_6039.html
/home/oracle/awrrpt_1_6038_6039.html
3 分析思路
1 cache size,观察主机内存情况,判断sga的内存分配是否合理
2 load profile的transactions,判断系统的繁忙程度
3 load profile的hard parses和parses值看硬解析是否过多,从而定位是否存在绑定变量
4 观察top 5 timed events查看系统的瓶颈所在,cpu排第一且占用大量时间,说明正常
5 一下order by语句,每类前几位的sql语句,并设法优化,同时注意善于发现主要矛盾,toatl为99%的
sql ordered by elapsed time
sql ordered by cup time
sql ordered by gets
sql ordered by reads
sql ordered by executions
sql ordered by parse calls
举例
WORKLOAD REPOSITORY report for

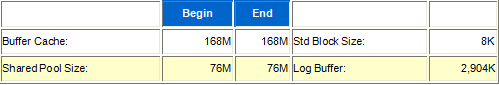
Report Summary
Cache Sizes
Load Profile
1 Load Profile
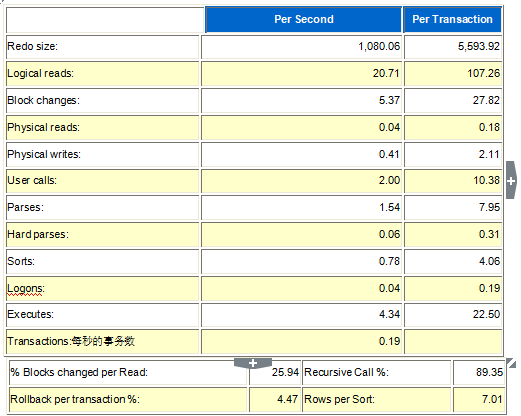
Transactions: 事务0.19 很小
2 排名靠前的事件
Top 5 Timed Events
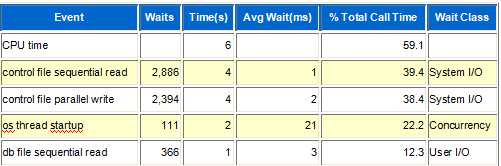
db file sequential read 主要跟执行的sql有关
Log file switch 等待事件,---当日志组写完后,lgwr试图写第一个logfile,如果此时数据库没有完成写出记录在第一个日志组中,表示dbwr写出太慢,解决方式:添加额外的dbwr或增加日志组或日志文件的大小
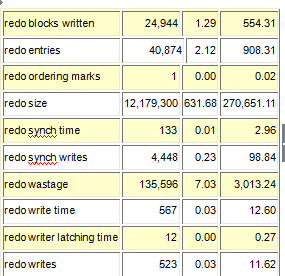
可以根据公式查询每个日志的平均读写的大小量
Average redo wirte size=(redo block written/redo writes)*512 bytes,值过小,说明系统的提交过于频繁,(29/523)*512=
Instance Activity Stats
sql> show parameter log_buffer 查看log_buffer的大小(一般4m),建议15-30m
SQL> show parameter log_buffer
NAME_COL_PLUS_SHO TYPE VALUE_COL_PLUS_SH
----------------- ----------- -----------------
log_buffer integer 2927616
3 观察各类开销最大的sql
根据db file sequential read/db file scattered read/cpu time来寻找根源
- SQL ordered by Elapsed Time—耗时sql 的排名
- SQL ordered by CPU Time cpu处理时间排名
- SQL ordered by Gets
- SQL ordered by Reads—物理读排名
- SQL ordered by Executions
- SQL ordered by Parse Calls
- SQL ordered by Sharable Memory
- SQL ordered by Version Count
- Complete List of SQL Text
SQL ordered by Elapsed Time
中SQL Text 可以看见执行的sql语句。。。
select * from v$sql where sql_id='bmb1w8zs830up'
select * from v$sqltext a,v$sql b
where a.hash_value=b.hash_value
and b.sql_id='bmb1w8zs830up';
select * from v$SQL_PLAN a,v$sql b
where a.hash_value=b.hash_value
and b.sql_id='bmb1w8zs830up';
SELECT hash_value, buffer_gets, disk_reads, executions, parse_calls
FROM V$SQLAREA
WHERE hash_Value=4035019605;
select * from DBA_SOURCE where owner='GRSV5' AND TEXT LIKE '% PARTNER_LEVEL, DIRECT_OWNER%';
SELECT *
FROM V$SQLAREA
WHERE buffer_gets > 10000000 OR disk_reads > 1000000
ORDER BY buffer_gets + 100 * disk_reads DESC;
4 制定总体优化方案
Redo file,批量提交,绑定变量,插入带序列的,全部增加cache
2 SQL_TRACE/10046事件
用来进行sql跟踪的强有力工具,可跟踪到sql的解析过程、执行计划、绑定变量、递归调用等详细信息
1 SQL_TRACE/10046 事件具体使用方法
A 当前session
--开启会话跟踪
alter session set sql_trace=true;
--关闭会话跟踪
alter session set sql_trace=false;
exec dbms_system.set_sql_trace_in_session(142,14,true)
exec dbms_system.set_sql_trace_in_session(142,14,false)
--开启会话跟踪 10046事件
alter session set events '10046 trace name context forever,level 12';
--关闭会话跟踪
alter session set events '10046 trace name context off';
SQL> show parameter max_dump_file_size
NAME TYPE VALUE
------------------------------------ ----------- ------------------------------
max_dump_file_size string UNLIMITED
SQL> show parameter timed_statistics
NAME TYPE VALUE
------------------------------------ ----------- ------------------------------
timed_statistics boolean TRUE
B 指定用户的session
SQL> select sid,serial#,username from v$session where username='SCOTT';
SID SERIAL# USERNAME
---------- ---------- ------------------------------
144 556 SCOTT
sys用户权限来开启和关闭跟踪
[oracle@localhost admin]$ sqlplus "/as sysdba"
SQL*Plus: Release 10.2.0.1.0 - Production on Tue Nov 26 16:36:19 2013
Copyright (c) 1982, 2005, Oracle. All rights reserved.
Connected to:
Oracle Database 10g Enterprise Edition Release 10.2.0.1.0 - Production
With the Partitioning, OLAP and Data Mining options
SQL> EXEC DBMS_SYSTEM.SET_EV(144,13,10046,8,'SCOTT');
PL/SQL procedure successfully completed.
EXEC DBMS_SYSTEM.SET_EV(137,9,10046,8,'SCOTT');
EXEC DBMS_SYSTEM.SET_EV(137,9,10046,0,'SCOTT');
2 获取跟踪文件
跟踪文件一般位于user_dump_dest目录下
1 通过脚本来定位
sql>SELECT c.value||'\'||d.instance_name||'_ora_'||a.spid||'.trc' trace_name_file
FROM v$process a, v$session b,v$parameter c,v$instance d
WHERE a.addr=b.paddr
and b.audsid=userenv('sessionid')
and c.name='user_dump_dest';
TRACE_NAME_FILE
------------------------------------------------------------
F:\ORACLE\PRODUCT\10.2.0\ADMIN\ORCL\UDUMP\orcl_ora_40656.trc
SELECT c.value||'/'||d.instance_name||'_ora_'||a.spid||'.trc' trace_name_file
FROM v$process a, v$session b,v$parameter c,v$instance d
WHERE a.addr=b.paddr
and b.audsid=userenv('sessionid')
and c.name='user_dump_dest';
/u01/app/oracle/admin/grs/udump/grs_ora_5808.trc
[oracle@localhost udump]$ find /u01/app/oracle/admin/grs/udump -name grs_ora_5808.trc
2 通过对跟踪文件加标示
Alter session set tracefile_identifier='10046';
Host dir F:\ORACLE\PRODUCT\10.2.0\ADMIN\ORCL\UDUMP\orcl_ora_40656.trc
host dir F:\ORACLE\PRODUCT\10.2.0\ADMIN\ORCL\UDUMP\*10046*
3 tkprof格式化
Tkprof是oracletrace自带的格式化工具
Tkprof tracefile outputfile [options]
CMD 下 tkprof
Tkprof F:\ORACLE\PRODUCT\10.2.0\ADMIN\ORCL\UDUMP\orcl_ora_10416.trc
Tkprof F:\ORACLE\PRODUCT\10.2.0\ADMIN\ORCL\UDUMP\orcl_ora_13444.trc f:\trace4180.txt
Tkprof /u01/app/oracle/admin/grs/udump/grs_ora_5808.trc /u01/app/oracle/trace10046_20131126.txt
C:\DocumentsandSettings\yanghongquan>tkprof F:\ORACLE\PRODUCT\10.2.0\ADMIN\ORCL\UDUMP\orcl_ora_10416.trc f:
TKPROF: Release 10.2.0.1.0 - Production on Fri May 17 14:17:45 2013
Copyright (c) 1982, 2005, Oracle. All rights reserved.
Dir d:\10046.txt
select * from emp1
minus
select * from emp
call count cpu elapsed disk query current rows
------- ------ -------- ---------- ---------- ---------- ---------- ----------
Parse 1 0.00 0.00 0 2 0 0
Execute 1 0.00 0.00 0 0 0 0
Fetch 2 0.00 0.00 0 14 0 3
------- ------ -------- ---------- ---------- ---------- ---------- ----------
total 4 0.00 0.00 0 16 0 3
Misses in library cache during parse: 1
Optimizer mode: ALL_ROWS
Parsing user id: 54
Rows Row Source Operation
------- ---------------------------------------------------
3 MINUS (cr=14 pr=0 pw=0 time=121 us)
16 SORT UNIQUE (cr=7 pr=0 pw=0 time=85 us)
16 TABLE ACCESS FULL EMP1 (cr=7 pr=0 pw=0 time=36 us)
14 SORT UNIQUE (cr=7 pr=0 pw=0 time=30 us)
14 TABLE ACCESS FULL EMP (cr=7 pr=0 pw=0 time=14 us)
小结:
1 对特定消耗资源的过程或者用户进程启用trace/10046
2 通过tkprof格式化trace file
3 分析格式化后的文件,找出相应的瓶颈
3 计时跟解析工具
1 sqlplus下 set timing on。可以看到执行时间,但是精度不高,有时候不准确
set serverout on
set timing on
declare
t number;
n number default 0;
begin
t:=DBMS_UTILITY.GET_TIME;
for i in 1..1e6 loop
n:=n+i;
end loop;
dbms_output.put_line(n||'time:'||(DBMS_UTILITY.GET_TIME-t)||'0ms');
end;
/
--不带括号
select dbms_utility.get_time from dual;
--带括号
select dbms_utility.get_time() from dual;
10g还提供了dbms_utility.get_cpu_time函数,
2 plsql_profiler-----DBMS_PROFILER
--要利用DBMS_PROFILER包需要一些准备工作。
1 /*
1.以sysdba角色执行ORACLE_HOME/rdbms/admin/profload.sql 脚本装载 PL/SQL Profiler包。注意DBMS_PROFILER 必须用SYS用户安装。
[oracle@localhost ~]$ sqlplus "/as sysdba"
SQL*Plus: Release 10.2.0.1.0 - Production on Wed Nov 27 11:05:37 2013
Copyright (c) 1982, 2005, Oracle. All rights reserved.
Connected to:
Oracle Database 10g Enterprise Edition Release 10.2.0.1.0 - Production
With the Partitioning, OLAP and Data Mining options
SQL> @/u01/app/oracle/product/10.2.0/db_1/rdbms/admin/profolad.sql
SP2-0310: unable to open file "/u01/app/oracle/product/10.2.0/db_1/rdbms/admin/profolad.sql"
SQL> !find /u01 -name profload.sql
/u01/app/oracle/product/10.2.0/db_1/rdbms/admin/profload.sql
---/u01/app/oracle/product/10.2.0/db_1/rdbms/admin/profload.sql
SQL> @/u01/app/oracle/product/10.2.0/db_1/rdbms/admin/profload.sql
Package created.
Grant succeeded.
Synonym created.
Library created.
Package body created.
Testing for correct installation
SYS.DBMS_PROFILER successfully loaded.
PL/SQL procedure successfully completed.
2.以PLSQL执行者用户执行ORACLE_HOME/rdbms/admin/proftab.sql脚本创建了下列3个工具表和一个序列plsql_profiler_runnumbe用于记录性能数据。
SQL> conn scott
Enter password:
Connected.
SQL> !find /u01 -name proftab.sql
/u01/app/oracle/product/10.2.0/db_1/rdbms/admin/proftab.sql
SQL> @/u01/app/oracle/product/10.2.0/db_1/rdbms/admin/proftab.sql
drop table plsql_profiler_data cascade constraints
*
ERROR at line 1:
ORA-00942: table or view does not exist
drop table plsql_profiler_units cascade constraints
*
ERROR at line 1:
ORA-00942: table or view does not exist
drop table plsql_profiler_runs cascade constraints
*
ERROR at line 1:
ORA-00942: table or view does not exist
drop sequence plsql_profiler_runnumber
*
ERROR at line 1:
ORA-02289: sequence does not exist
Table created.
Comment created.
Table created.
Comment created.
Table created.
Comment created.
Sequence created.
12c
SQL> conn /as sysdba
Connected.
SQL> alter session set container=PDBORCL;
Session altered.
SQL> @/u01/app/oracle/product/12.1.0/dbhome_1/rdbms/admin/profload.sql
SQL> conn SOCIALDIAL/[email protected]
Connected.
SQL> !find /u01 -name proftab.sql
/u01/app/oracle/product/12.1.0/dbhome_1/rdbms/admin/proftab.sql
SQL> @/u01/app/oracle/product/12.1.0/dbhome_1/rdbms/admin/proftab.sql
drop table plsql_profiler_data cascade constraints
*
*
2 */
--单独创建一个用户作为工具表的属主,然后授予必要的访问权限给需要剖析的用户
--给所有用户授予访问工具表的权限的例子
CONNECT sys/password@service AS SYSDBA
@$ORACLE_HOME/rdbms/admin/profload.sql
CREATE USER profiler IDENTIFIED BY profiler DEFAULT TABLESPACE users QUOTA UNLIMITED ON users;
--下一行适用于9i的环境,在10g中connect角色已经不再包含CREATE TABLE和CREATE SEQUENCE的权限,需要直接显式授权
GRANT connect TO profiler;
CREATE PUBLIC SYNONYM plsql_profiler_runs FOR profiler.plsql_profiler_runs;
CREATE PUBLIC SYNONYM plsql_profiler_units FOR profiler.plsql_profiler_units;
CREATE PUBLIC SYNONYM plsql_profiler_data FOR profiler.plsql_profiler_data;
CREATE PUBLIC SYNONYM plsql_profiler_runnumber FOR profiler.plsql_profiler_runnumber;
CONNECT profiler/profiler@service
@$ORACLE_HOME/rdbms/admin/proftab.sql
GRANT SELECT ON plsql_profiler_runnumber TO PUBLIC;
GRANT SELECT, INSERT, UPDATE, DELETE ON plsql_profiler_data TO PUBLIC;
GRANT SELECT, INSERT, UPDATE, DELETE ON plsql_profiler_units TO PUBLIC;
GRANT SELECT, INSERT, UPDATE, DELETE ON plsql_profiler_runs TO PUBLIC;
--给所有用户授予访问工具表的权限的例子
Conn / as sysdba CONNECT sys/password@service AS SYSDBA---sysdba
@F:\oracle\product\10.2.0\db_1\RDBMS\admin\profload.sql
Connect scott/orcl@orcl----scott
@F:\oracle\product\10.2.0\db_1\RDBMS\admin\proftab.sql
DBMS_PROFILER.START_PROFILER('用户注释');--开始对一次运行记录信息。
…
需要剖析的代码块
…
DBMS_PROFILER.STOP_PROFILER;--结束一次运行的信息记录。
例如
1 先创建一个程序
2 执行一个匿名块,把这个过程作为一个整体调用
DECLARE
l_result BINARY_INTEGER;
BEGIN
l_result := DBMS_PROFILER.start_profiler(run_comment => 'PRIMEY0: ' || SYSDATE);
primey0(10000);--- 'PRIMEY0需要剖析的过程名
l_result := DBMS_PROFILER.stop_profiler;
END;
/
begin
DBMS_PROFILER.START_PROFILER('bluck_foall_edit');
bluck_foall_edit;
DBMS_PROFILER.STOP_PROFILER;
end;
DECLARE
P_PROVIDERID VARCHAR2(32767);
P_USERID VARCHAR2(32767);
P_LINKID VARCHAR2(32767);
P_LINKTYPE VARCHAR2(32767);
P_CATAGORY VARCHAR2(32767);
P_STATUS VARCHAR2(32767);
P_REGISTERTYPE VARCHAR2(32767);
P_RETURN NUMBER;
begin
DBMS_PROFILER.START_PROFILER('DIAL_LINK_REGISTER');
P_LINKID:='yyy23232';---IN OUT类型,必须使用变量
DIAL_LINK_REGISTER ( 'GLOBALROAM', '1585@gr', P_LINKID, 'ID', P_CATAGORY, 'STATUS', P_REGISTERTYPE, P_RETURN );
DBMS_PROFILER.STOP_PROFILER;
end;
-----
3 */ 解析剖析的一次运行的RUNID
SELECT runid,
run_date,
run_comment,
run_total_time
FROM plsql_profiler_runs
ORDER BY runid;
4 输入runid
SELECT u.runid, u.unit_number, u.unit_type, u.unit_owner, u.unit_name,
d.line#, d.total_occur—执行次数, d.total_time, d.min_time, d.max_time
FROM plsql_profiler_units u
JOIN plsql_profiler_data d ON u.runid = d.runid AND u.unit_number = d.unit_number
WHERE u.runid = xxx
ORDER BY u.unit_number, d.line#;
SELECT u.runid, u.unit_number, u.unit_type, u.unit_owner, u.unit_name,
d.line#, d.total_occur, to_char(d.total_time/100000000), d.min_time, d.max_time
FROM plsql_profiler_units u
JOIN plsql_profiler_data d ON u.runid = d.runid AND u.unit_number = d.unit_number
WHERE u.runid =12 and d.total_time>=1
ORDER BY u.unit_number, d.line#;
5 SELECT line || ' : ' || text
FROM all_source
WHERE owner = 'SCOTT' --当前会话用户,也可以是其他用户,比如'LT'
AND type = 'PROCEDURE'
AND name = 'PRIMEY0';
在all_source中查看程序的源码,具体要哪一行
-----
Oracle自己的一个脚本
SQL> !find /u01 -name profrep.sql
/u01/app/oracle/profrep.sql
SQL> @/u01/app/oracle/profrep.sql
--输出每次运行的详细报告
exec prof_report_utilities.print_detailed_report;
--输出每个模块运行的累计报告
exec prof_report_utilities.print_summarized_report;
使用 prof.zip 格式化报表:
下载prof.zip
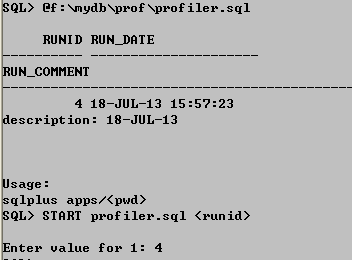
SQL> @D:\prof\profiler.sql------ @f:\mydb\prof\profiler.sql
/*
RUNID RUN_DATE RUN_COMMENT
---------- ------------------- -------------
…
3 27-6月 -10 15:38:20 PRIMEY0
*/
--看到runid是3,然后按照提示输入:
START profiler.sql <runid>
当前目录下:
C:\Documents and Settings\yanghongquan
--输入 1 的值: 3
PL/SQL provides a mechanism to obtain timings of code execution that are accurate to 100th of a second: the DBMS_UTILTY.GET_TIME function. Yes, that's right. I said 100th of a second. 0.01秒
DECLARE
time_before BINARY_INTEGER;
time_after BINARY_INTEGER;
BEGIN
time_before := DBMS_UTILITY.GET_TIME;
BLOCK_IP;
time_after := DBMS_UTILITY.GET_TIME;
DBMS_OUTPUT.PUT_LINE ('usetime=='||to_char(time_after - time_before));
END;
declare
t number;
n number default 0;
begin
t:=DBMS_UTILITY.GET_TIME;
for i in 1 .. 1e6 loop
n:=n+1;
end loop;
DBMS_OUTPUT.PUT_LINE ('usetime=='||(DBMS_UTILITY.GET_TIME-t)||'0ms');
end;