C++程序崩溃解决方案
如需转载请标明出处:http://blog.csdn.net/itas109
QQ技术交流群:129518033
目录
文章目录
文章目录
环境:
QT版本:5.6.2
开发环境:VS2013
系统版本:windows 7 64bit
前言
C++程序崩溃如何进行异常捕获处理?特别是发布版本为Release版本,要想保留现场和复现就更加困难。本文较少几种捕获程序异常定位问题的方案。
1. SetUnhandledExceptionFilter+ MiniDumpWriteDump + PDB解决方案
1.1 SetUnhandledExceptionFilter简介
Windows为应用程序提供了一种通过SetUnhandledExceptionFilter函数覆盖默认应用程序“崩溃”处理功能的方法。
通常,SetUndhandledExceptionFilter函数与崩溃报告一起使用。 能够精确定位引起崩溃的代码行在事后调试中是非常宝贵的。
| 参数 | 要求 |
|---|---|
| 最小PC系统 | Windows XP |
| 最小服务器系统 | Windows Server 2003 |
| 头文件 | WinBase.h (包含在Windows.h) |
| Library | Kernel32.lib |
| DLL | Kernel32.dll |
语法:
LPTOP_LEVEL_EXCEPTION_FILTER WINAPI SetUnhandledExceptionFilter(
  _In_ LPTOP_LEVEL_EXCEPTION_FILTER lpTopLevelExceptionFilter
);
1.2 MiniDumpWriteDump简介
MiniDumpWriteDump将用户模式minidump信息写入指定的文件。
| 参数 | 要求 |
|---|---|
| 平台 | Windows |
| 头文件 | minidumpapiset.h (包含在Dbghelp.h) |
| Library | Dbghelp.lib |
| DLL | Dbghelp.dll; Dbgcore.dll |
| 发布需求 | DbgHelp.dll and Dbgcore.dll |
语法:
BOOL MiniDumpWriteDump(
  HANDLE                            hProcess,
  DWORD                             ProcessId,
  HANDLE                            hFile,
  MINIDUMP_TYPE                     DumpType,
  PMINIDUMP_EXCEPTION_INFORMATION   ExceptionParam,
  PMINIDUMP_USER_STREAM_INFORMATION UserStreamParam,
  PMINIDUMP_CALLBACK_INFORMATION    CallbackParam
);
1.3 PDB简介
MSDN : Program Database Files (C++)
1.4 捕获异常
1.4.1 pro文件
win32:LIBS += -lDbgHelp
1.4.2 头文件
    #include "Windows.h"
    #include <dbghelp.h>
1.4.3 异常捕获函数
//异常捕获函数
long ApplicationCrashHandler(EXCEPTION_POINTERS *pException)
{
    {
        // 在程序exe的上级目录中创建dmp文件夹
        QDir *dmp = new QDir;
        bool exist = dmp->exists("./dmp");
        if(exist == false)
        {
            dmp->mkdir("./dmp");
        }
    }

    QDateTime current_date_time = QDateTime::currentDateTime();
    QString current_date = current_date_time.toString("yyyy_MM_dd_hh_mm_ss");
    QString time =  current_date + ".dmp";
    EXCEPTION_RECORD *record = pException->ExceptionRecord;
    QString errCode(QString::number(record->ExceptionCode, 16));
    QString errAddr(QString::number((uint)record->ExceptionAddress, 16));
    QString errFlag(QString::number(record->ExceptionFlags, 16));
    QString errPara(QString::number(record->NumberParameters, 16));
    qDebug()<< "errCode: "<<errCode;
    qDebug()<< "errAddr: "<<errAddr;
    qDebug()<< "errFlag: "<<errFlag;
    qDebug()<< "errPara: "<<errPara;

    //创建 Dump 文件
    HANDLE hDumpFile = CreateFile((LPCWSTR)QString("./dmp/" + time).utf16(),
                                  GENERIC_WRITE, 0, NULL, CREATE_ALWAYS, FILE_ATTRIBUTE_NORMAL, NULL);

    if(hDumpFile != INVALID_HANDLE_VALUE)
    {
        //Dump信息
        MINIDUMP_EXCEPTION_INFORMATION dumpInfo;
        dumpInfo.ExceptionPointers = pException;
        dumpInfo.ThreadId = GetCurrentThreadId();
        dumpInfo.ClientPointers = TRUE;
        //写入Dump文件内容
        MiniDumpWriteDump(GetCurrentProcess(), GetCurrentProcessId(),hDumpFile, MiniDumpNormal, &dumpInfo, NULL, NULL);
        CloseHandle(hDumpFile);
    }
    else
    {
        qDebug()<< "hDumpFile == null";
    }

    //这里弹出一个错误对话框并退出程序
    QMessageBox::critical(NULL,QString::fromLocal8Bit("程序崩溃"),
                          QString::fromLocal8Bit("对于发生的错误,表示诚挚的歉意\n错误代码:%1\n错误地址:%2").arg(errCode).arg(errAddr),
                          QMessageBox::Ok);

    return EXCEPTION_EXECUTE_HANDLER;
}
1.4.4 主函数调用
    int main(int argc, char *argv[])
    {
        //注册异常捕获函数
        SetUnhandledExceptionFilter((LPTOP_LEVEL_EXCEPTION_FILTER)ApplicationCrashHandler);
        ...
    }
1.5 分析异常
经过上面的设置可以生成*.dmp文件,结合*.pdb(如何使QT的Release模式可调试(Windows))就可以定位到源码中的函数,乃至于行数。
1.5.1 解析dmp
Windows 调试程序 (WinDbg) 可用于调试内核和用户模式代码,分析故障转储并检查 CPU 注册代码执行。
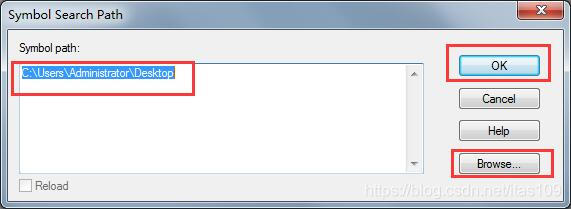
1.5.1.1 设置符号文件路径
也就是*.pdb的路径
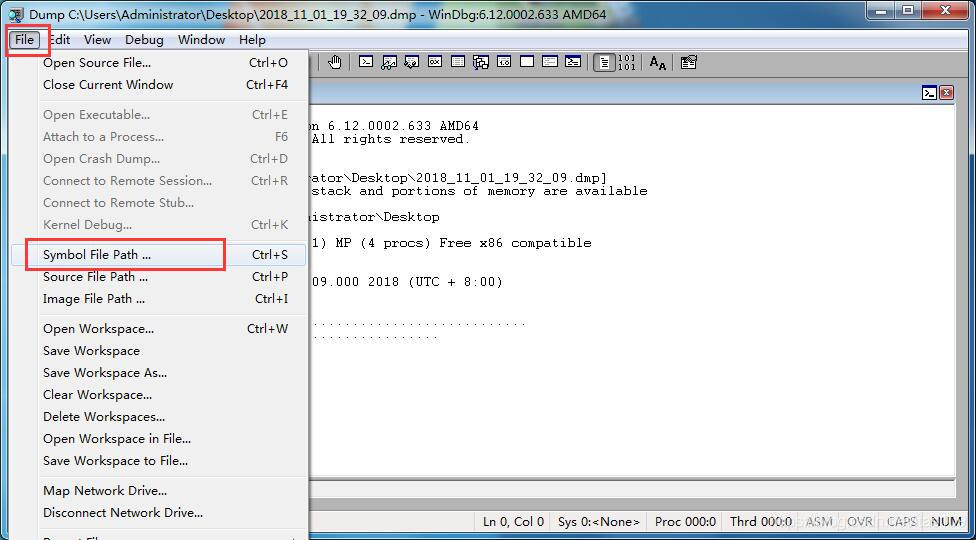
1.5.1.1 打开*.dmp文件
Microsoft (R) Windows Debugger Version 6.12.0002.633 AMD64
Copyright (c) Microsoft Corporation. All rights reserved.


Loading Dump File [C:\Users\Administrator\Desktop\2018_11_01_19_32_09.dmp]
User Mini Dump File: Only registers, stack and portions of memory are available

Symbol search path is: C:\Users\Administrator\Desktop
Executable search path is:
Windows 7 Version 7601 (Service Pack 1) MP (4 procs) Free x86 compatible
Product: WinNt, suite: SingleUserTS
Machine Name:
Debug session time: Thu Nov  1 19:32:09.000 2018 (UTC + 8:00)
System Uptime: not available
Process Uptime: 0 days 0:00:01.000
................................................................
.....................................................
This dump file has an exception of interest stored in it.
The stored exception information can be accessed via .ecxr.
(be0.ccc): Integer divide-by-zero - code c0000094 (first/second chance not available)
eax=fffffffd ebx=03331020 ecx=0058eaec edx=77a96c74 esi=03330fe0 edi=0058eb8c
eip=77a96c74 esp=0058e84c ebp=0058e85c iopl=0         nv up ei pl zr na pe nc
cs=001b  ss=0023  ds=0023  es=0023  fs=003b  gs=0000             efl=00000246
Unable to load image C:\Windows\System32\ntdll.dll, Win32 error 0n2
*** WARNING: Unable to verify timestamp for ntdll.dll
*** ERROR: Module load completed but symbols could not be loaded for ntdll.dll
ntdll+0x46c74:
77a96c74 c3              ret
1.5.2 结合PDB定位具体函数
输入命令,等待几秒后会打印出错误信息
!analyze -v
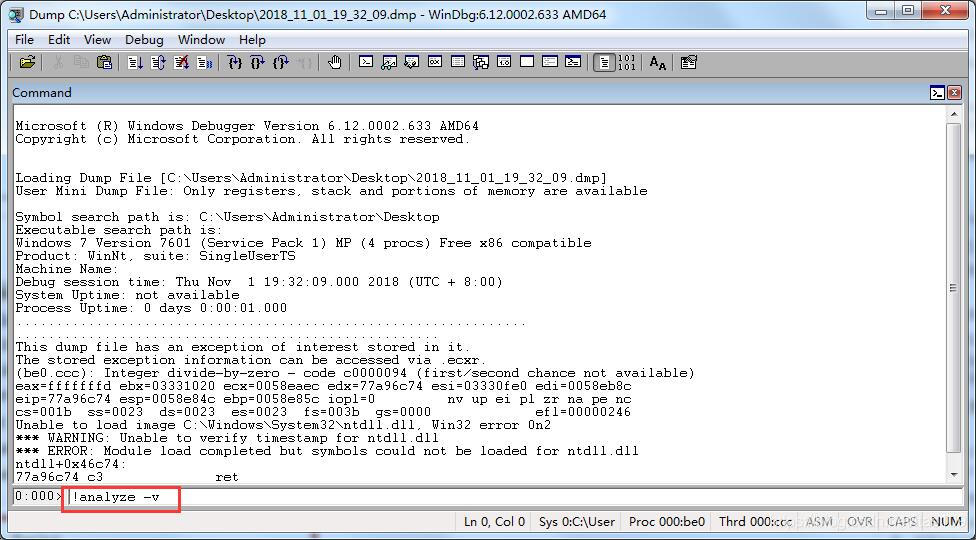
至此,可以准确找到出现问题的函数。
2. Google Breakpad方案
Google breakpad是一个跨平台的崩溃转储和分析框架和工具集合。
默认情况下,当崩溃时breakpad会生成一个minidump文件,在不同平台上的实现机制不一样:
在windows平台上,使用微软提供的 SetUnhandledExceptionFilter() 方法来实现。
在OS X平台上,通过创建一个线程来监听 Mach Exception port 来实现。
在Linux平台上,通过设置一个信号处理器来监听 SIGILL SIGSEGV 等异常信号。
Source Code:
http://code.google.com/p/google-breakpad/
该方案将在后续文章中详细介绍。
Reference:
1.MSDN : SetUnhandledExceptionFilter函数
2.MSDN : MiniDumpWriteDump函数
觉得文章对你有帮助,可以用微信扫描二维码捐赠给博主,谢谢!
如需转载请标明出处:http://blog.csdn.net/itas109
QQ技术交流群:129518033