众所周知,matlab中信号处理的工具箱十分强大,但因为一些深度学习实时性的需求,博主不得不转至python,下面是用python编写的一个完整的测试;实现了BPSK的相干解调,门限使用积分判决。
源码:
# -*- coding:utf-8 -*-
import numpy as np
from math import pi
import matplotlib.pyplot as plt
import matplotlib
import scipy.signal as signal
import math
#码元数
size = 10
sampling_t = 0.01
t = np.arange(0, size, sampling_t)
# 随机生成信号序列
a = np.random.randint(0, 2, size)
m = np.zeros(len(t), dtype=np.float32)
for i in range(len(t)):
m[i] = a[math.floor(t[i])]
fig = plt.figure()
ax1 = fig.add_subplot(3, 1, 1)
# 解决set_title中文乱码
zhfont1 = matplotlib.font_manager.FontProperties(fname = 'C:\Windows\Fonts\simsun.ttc')
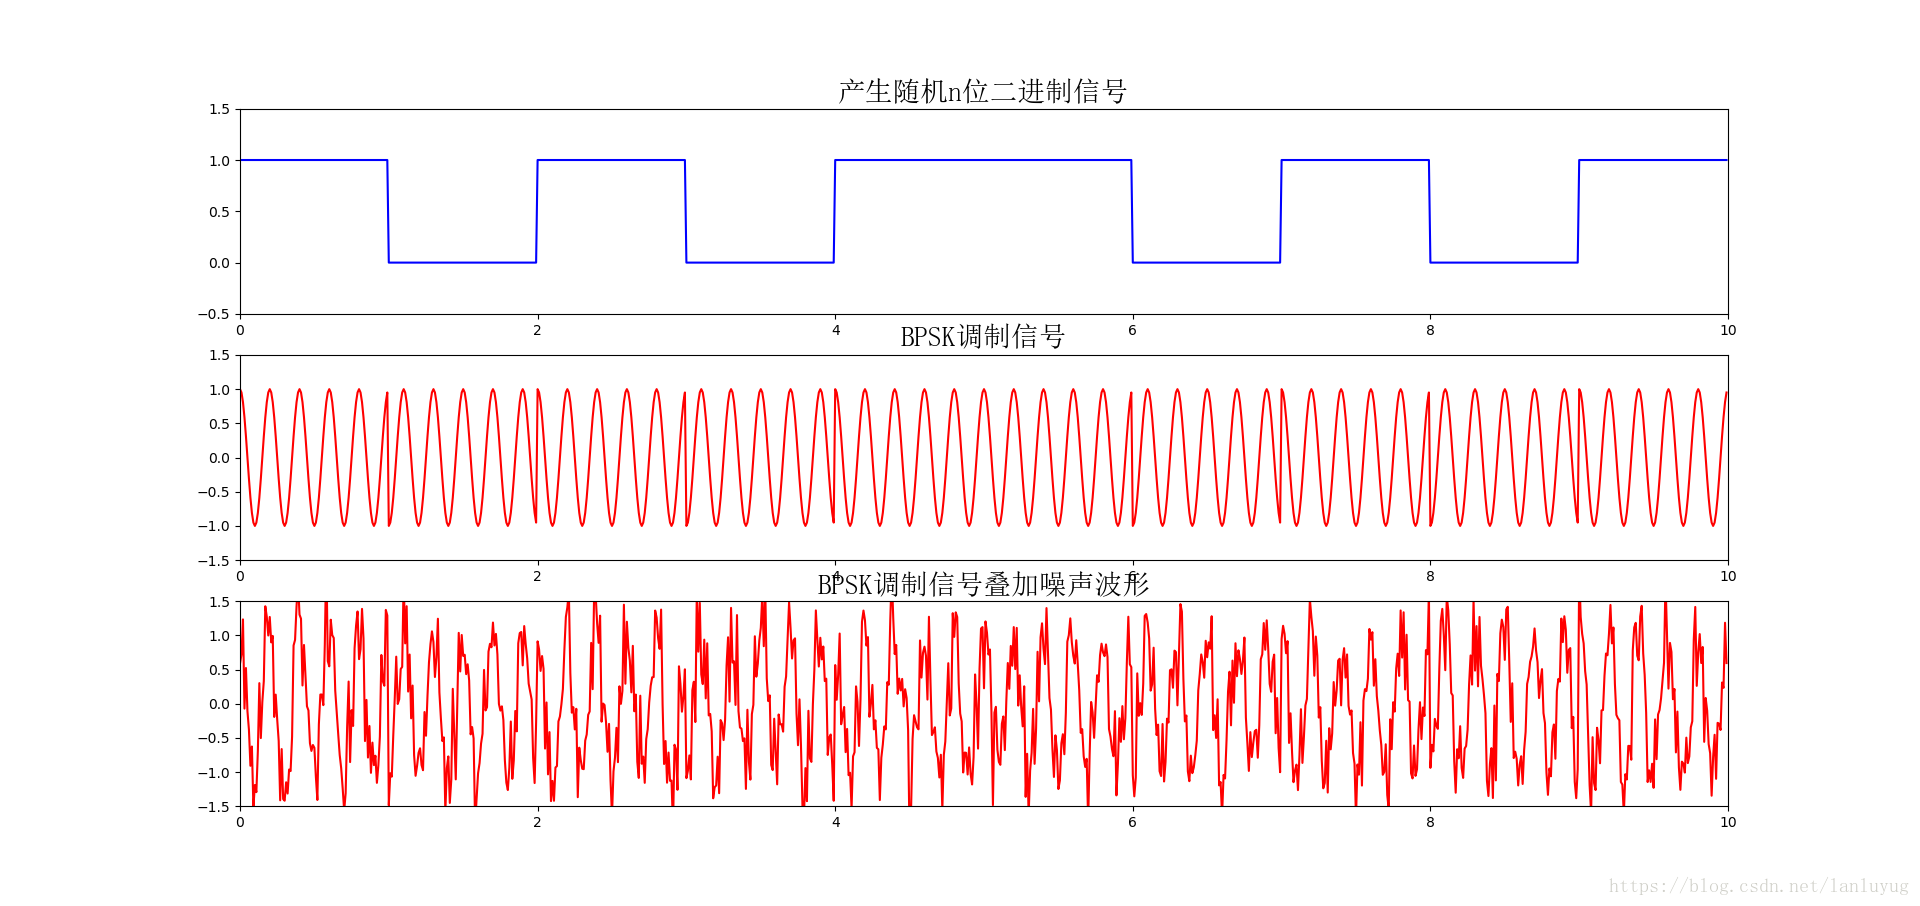
ax1.set_title('产生随机n位二进制信号', fontproperties = zhfont1, fontsize = 20)
plt.axis([0, size, -0.5, 1.5])
plt.plot(t, m, 'b')
fc = 4000
fs = 20 * fc # 采样频率
ts = np.arange(0, (100 * size) / fs, 1 / fs)
coherent_carrier = np.cos(np.dot(2 * pi * fc, ts))
bpsk = np.cos(np.dot(2 * pi * fc, ts) + pi * (m - 1) + pi / 4)
# BPSK调制信号波形
ax2 = fig.add_subplot(3, 1, 2)
ax2.set_title('BPSK调制信号', fontproperties=zhfont1, fontsize=20)
plt.axis([0,size,-1.5, 1.5])
plt.plot(t, bpsk, 'r')
# 定义加性高斯白噪声
def awgn(y, snr):
snr = 10 ** (snr / 10.0)
xpower = np.sum(y ** 2) / len(y)
npower = xpower / snr
return np.random.randn(len(y)) * np.sqrt(npower) + y
# 加AWGN噪声
noise_bpsk = awgn(bpsk, 5)
# BPSK调制信号叠加噪声波形
ax3 = fig.add_subplot(3, 1, 3)
ax3.set_title('BPSK调制信号叠加噪声波形', fontproperties = zhfont1, fontsize = 20)
plt.axis([0, size, -1.5, 1.5])
plt.plot(t, noise_bpsk, 'r')
# 带通椭圆滤波器设计,通带为[2000,6000]
[b11,a11] = signal.ellip(5, 0.5, 60, [2000 * 2 / 80000, 6000 * 2 / 80000], btype = 'bandpass', analog = False, output = 'ba')
# 低通滤波器设计,通带截止频率为2000Hz
[b12,a12] = signal.ellip(5, 0.5, 60, (2000 * 2 / 80000), btype = 'lowpass', analog = False, output = 'ba')
# 通过带通滤波器滤除带外噪声
bandpass_out = signal.filtfilt(b11, a11, noise_bpsk)
# 相干解调,乘以同频同相的相干载波
coherent_demod = bandpass_out * (coherent_carrier * 2)
# 通过低通滤波器
lowpass_out = signal.filtfilt(b12, a12, coherent_demod)
fig2 = plt.figure()
bx1 = fig2.add_subplot(3, 1, 1)
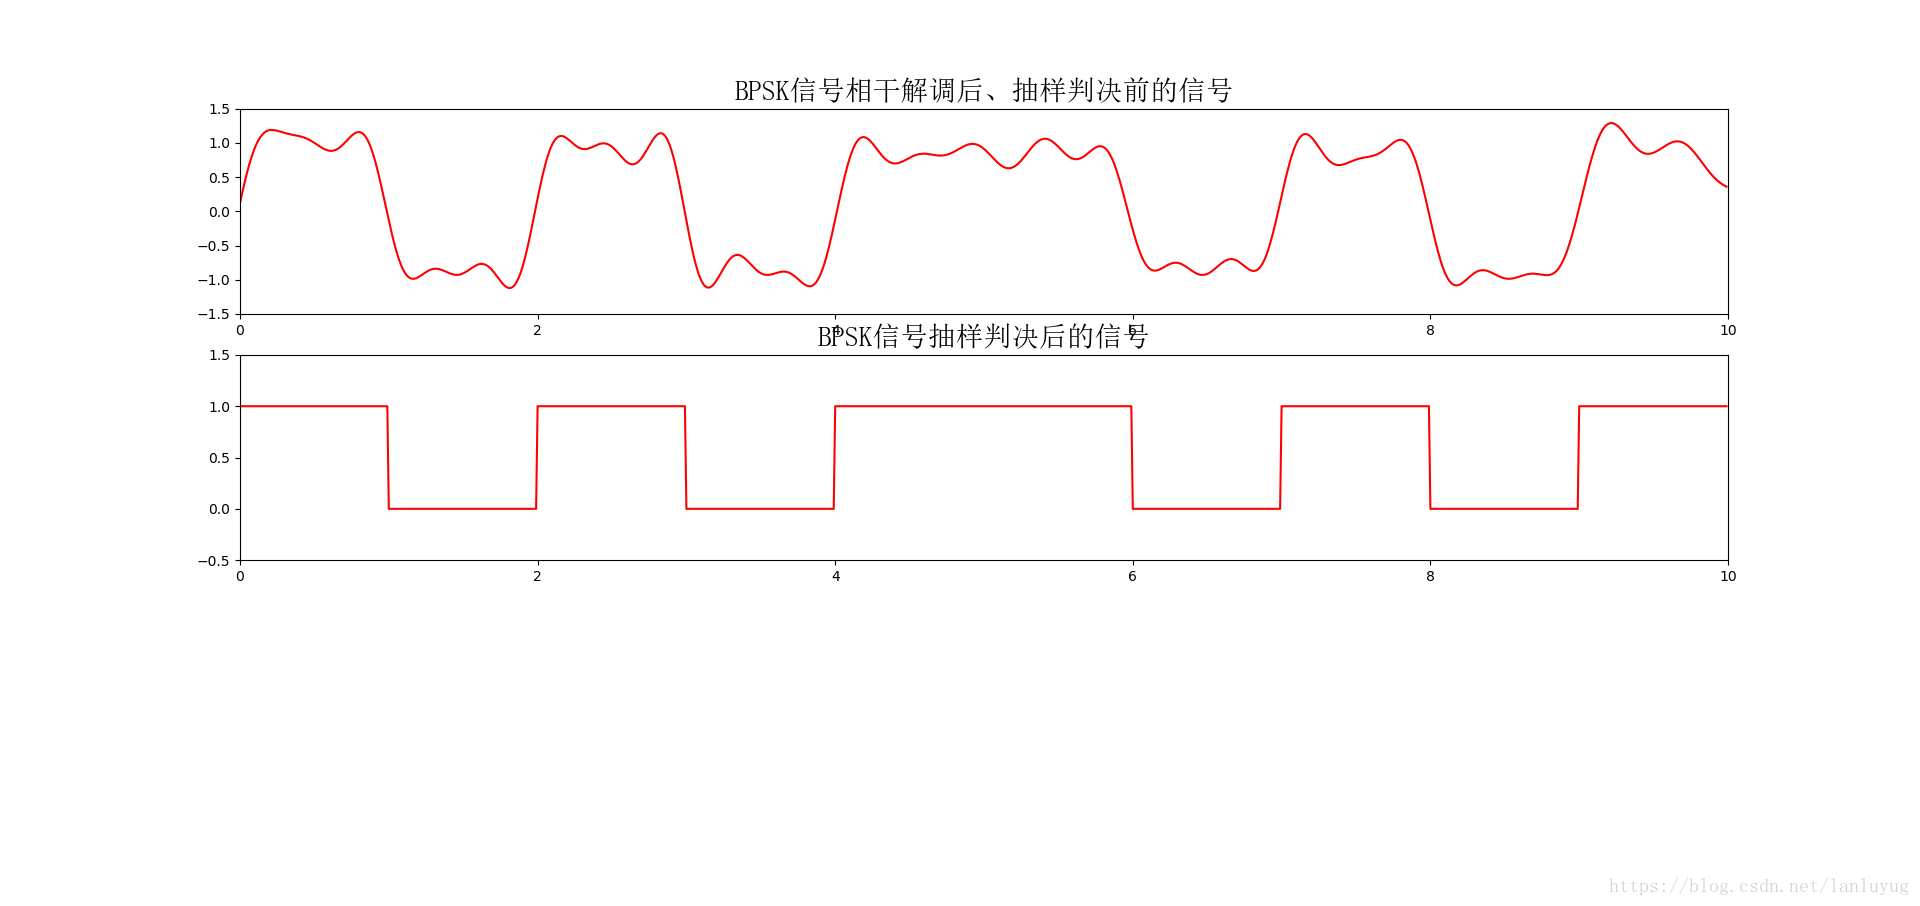
bx1.set_title('本地载波下变频,经低通滤波器后', fontproperties = zhfont1, fontsize=20)
plt.axis([0, size, -1.5, 1.5])
plt.plot(t, lowpass_out, 'r')
#抽样判决
detection_bpsk = np.zeros(len(t), dtype=np.float32)
flag = np.zeros(size, dtype=np.float32)
for i in range(10):
tempF = 0
for j in range(100):
tempF = tempF + lowpass_out[i * 100 + j]
if tempF > 0:
flag[i] = 1
else:
flag[i] = 0
for i in range(size):
if flag[i] == 0:
for j in range(100):
detection_bpsk[i * 100 + j] = 0
else:
for j in range(100):
detection_bpsk[i * 100 + j] = 1
bx2 = fig2.add_subplot(3, 1, 2)
bx2.set_title('BPSK信号抽样判决后的信号', fontproperties = zhfont1, fontsize=20)
plt.axis([0, size, -0.5, 1.5])
plt.plot(t, detection_bpsk, 'r')
plt.show()
显示结果: