前言
数据库的性能与每一行代码息息相关,所以,每次写代码可以考虑一下在不同级别的数据量下面测试一下性能。
本文参考了:
Postgresql生成大量测试数据
以及
准备测试用数据
此次测试我们将分别用10w,100w以及1000w级别的表来测试,下面先建立一波数据表。
-- 测试用数据表,分别为10w,100w以及1000w级别。表结构基本一致。
create table tbl_test_10w (
id serial primary key,
"name" varchar(200) null,
"groupid" integer null,
create_time timestamp(0) without time zone
);
insert into tbl_test_10w (name,groupid,create_time)
select md5(n::varchar||random()::varchar) as "name",
(floor(RANDOM()*(100))::int%15) as groupid,
('2018-5-1'::date + trunc(random()*100)::integer +' 00:22:22'::time + (trunc(random()*3600*24)||' second')::interval) as create_time
 from generate_series(0,100000) n;
select count(*) from tbl_test_10w;

-- 100w数据量

create table tbl_test_100w (
id serial primary key,
"name" varchar(200) null,
"groupid" integer null,
create_time timestamp(0) without time zone
);
insert into tbl_test_100w (name,groupid,create_time)
select md5(n::varchar||random()::varchar) as "name",
(floor(RANDOM()*(100))::int%15) as groupid,
('2018-5-1'::date + trunc(random()*100)::integer +' 00:22:22'::time + (trunc(random()*3600*24)||' second')::interval) as create_time
 from generate_series(0,1000000) n;
select count(*) from tbl_test_100w;
-- 1000w数据量

create table tbl_test_1000w (
id serial primary key,
"name" varchar(200) null,
"groupid" integer null,
create_time timestamp(0) without time zone
);
insert into tbl_test_1000w (name,groupid,create_time)
select md5(n::varchar||random()::varchar) as "name",
(floor(RANDOM()*(100))::int%15) as groupid,
('2018-5-1'::date + trunc(random()*100)::integer +' 00:22:22'::time + (trunc(random()*3600*24)||' second')::interval) as create_time
 from generate_series(0,10000000) n;
select count(*) from tbl_test_1000w;
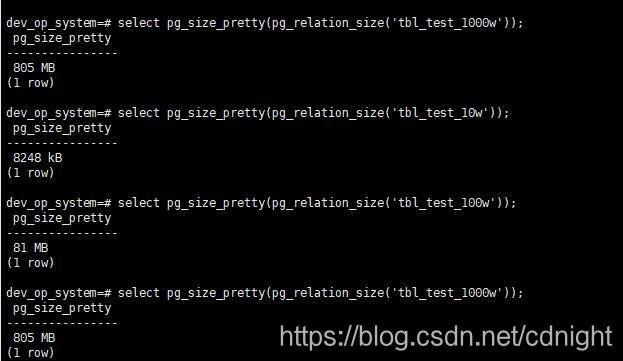
接下来,看看这些记录占用空间:
select pg_size_pretty(pg_relation_size('tbl_test_1000w'));
性能测试工具
待会需要用到:top free vmstat iostat【可能会用】等工具,用的是centos7系统,
还有,可以参考:
Linux监控命令整理(top,free,vmstat,iostat,mpstat,sar,netstat)
性能测试
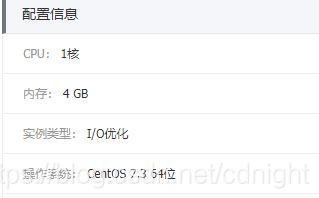
先说一下渣机,阿里云上面的配置:
然后再说明一下测试代码,首先,全局配置 config:
-- 这是全局配置

create or replace function config(

)
returns jsonb
language 'plpgsql'
IMMUTABLE
as $body$

declare job_manager_config constant jsonb := '{
"pager":{
		"pageSize":20
}

}';

BEGIN

return job_manager_config;

END;
$body$;

-- 快速获取配置项。

create or replace function config(
variadic path_array text[]
)
returns text
LANGUAGE 'plpgsql'
IMMUTABLE
as $body$

begin
return jsonb_extract_path_text(config(),variadic path_array);
end;
$body$;
针对系统的自定义类型:
/***
系统基本类型。
***/
-- 2018-10-28
drop type sys_types_pager_outline;
create  type sys_type_pager_outline as (
    "pageIndex" integer,
    "pageSize" integer,
    "total" integer,
    "totalPages" integer,
		"beginIndex" integer,
    "state" boolean,
    "stateCode" integer,
    "message" varchar(600)
);
drop type sys_type_operation_outline;
create type sys_type_operation_outline as (
    "state" boolean,
    "stateCode" integer,
    "message" varchar(600)
);
分页偏移量计算:
/****系统基本函数**/

-- 计算分页的偏移还有总页码等信息。
create or replace function sys_func_cal_pager(
in pageIndex integer,
in pageSize integer,
in totalSize integer
)
returns sys_type_pager_outline
as
$body$
declare pagerOutLine sys_type_pager_outline;

begin

-- 初始化分页基本数据。
pagerOutLine."pageIndex":=1;
pagerOutLine."pageSize":=config('pager','pageSize');
pagerOutLine."total":=0;
pagerOutLine."totalPages":=0;
pagerOutLine."beginIndex":=0;

if pageIndex > 0 then
pagerOutLine."pageIndex":=pageIndex;
end if;

if pageSize > 0 then
pagerOutLine."pageSize"=pageSize;
end if;

if totalSize > 0 then
pagerOutLine."total":=totalSize;

-- 计算总页码
if pagerOutLine."total" % pagerOutLine."pageSize" = 0  then
pagerOutLine."totalPages" := pagerOutLine."total"/pagerOutLine."pageSize";
else
pagerOutLine."totalPages" := (pagerOutLine."total"-(pagerOutLine."total"%pagerOutLine."pageSize"))/pagerOutLine."pageSize"+1;
end if;
-- 计算当前页码是不是超出正常水平
if pagerOutLine."pageIndex" > pagerOutLine."totalPages" then
pagerOutLine."pageIndex" := pagerOutLine."totalPages";
end if;

-- 计算offset
pagerOutLine."beginIndex"=(pagerOutLine."pageIndex"-1) * pagerOutLine."pageSize";


else

pagerOutLine."total":=0;
pagerOutLine."totalPages":=0;
pagerOutLine."pageIndex":=1;
pagerOutLine."beginIndex":=0;
end if;


return pagerOutLine;

end;
$body$ language plpgsql volatile;
好了,接下来才是正主,几个测试用分页存储过程:
/*********为了可以测试各个数量级的性能,请届时将tbl_test_1000w这个名称换成100w以及10w级别的。*************/

/***
*
* 测试用分页存储过程,其中利用了临时表保存中间记录集
*
***/
CREATE OR REPLACE FUNCTION public.test_case_search_pager_using_temp_table(
	in pageindex integer,
	in pagesize integer,
	cnd_eq_id integer,
	cnd_min_groupid integer,
	cnd_max_groupid integer,
	cnd_begin_create_time timestamp without time zone,
	cnd_end_create_time timestamp without time zone,
	outline_cursor refcursor,
	records_cursor refcursor)
    RETURNS setof refcursor
AS $BODY$
declare pagerOutLine sys_type_pager_outline;
declare totalSize integer;
declare tmpStr varchar(400);
begin


-- 根据条件查询列表,然后存放到临时表里面去。

create temp table "temp_tbl4pager"
on commit drop
as select * from
(
select * from tbl_test_1000w
where 1=1
and
case when cnd_eq_id is not null then "id"=cnd_eq_id else 1=1 end
and
case when cnd_min_groupid is not null then "groupid">cnd_min_groupid else 1=1 end

and
case when cnd_max_groupid is not null then "groupid"<cnd_max_groupid else 1=1 end

and
case when cnd_begin_create_time is not null then "create_time">cnd_begin_create_time else 1=1 end
and
case when cnd_end_create_time is not null then "create_time"< cnd_end_create_time else 1=1 end
) tbl_middle;

select count(*) into totalSize from temp_tbl4pager;


pagerOutLine:=sys_func_cal_pager(pageIndex,pageSize,totalSize);
-- raise notice '好了,看看pagerOutline的数据:';
-- raise notice '看看pagerOutLine里面的数据:%,真奇怪,那么,totalSize 是:%',pagerOutLine,totalSize;
-- 定义返回的状态。
pagerOutLine."state":=true;
pagerOutLine."stateCode":=0;
pagerOutLine."message":='';

-- 返回相关数据。
open outline_cursor for select pagerOutLine;
open records_cursor for select * from temp_tbl4pager limit pagerOutLine."pageSize" offset pagerOutLine."beginIndex";


-- 返回数据
return next outline_cursor;
return next records_cursor;

end;

$BODY$ LANGUAGE plpgsql volatile;


/***
*
* 测试用分页存储过程,其中使用了cte
*
***/
CREATE OR REPLACE FUNCTION public.test_case_search_pager_using_cte(
	in pageindex integer,
	in pagesize integer,
	cnd_eq_id integer,
	cnd_min_groupid integer,
	cnd_max_groupid integer,
	cnd_begin_create_time timestamp without time zone,
	cnd_end_create_time timestamp without time zone,
	outline_cursor refcursor,
	records_cursor refcursor)
    RETURNS setof refcursor
AS $BODY$
declare pagerOutLine sys_type_pager_outline;
declare totalSize integer;
declare tmpStr varchar(400);
begin


-- 首先获取记录总数
with tbl_middle as (
select * from tbl_test_1000w
where 1=1
and
case when cnd_eq_id is not null then "id"=cnd_eq_id else 1=1 end
and
case when cnd_min_groupid is not null then "groupid">cnd_min_groupid else 1=1 end

and
case when cnd_max_groupid is not null then "groupid"<cnd_max_groupid else 1=1 end

and
case when cnd_begin_create_time is not null then "create_time">cnd_begin_create_time else 1=1 end
and
case when cnd_end_create_time is not null then "create_time"< cnd_end_create_time else 1=1 end
)
select count(*) into totalSize from tbl_middle;


-- 然后计算beginIndex,totalPages
pagerOutLine:=sys_func_cal_pager(pageIndex,pageSize,totalSize);
-- raise notice '好了,看看pagerOutline的数据:';
-- raise notice '看看pagerOutLine里面的数据:%,真奇怪,那么,totalSize 是:%',pagerOutLine,totalSize;
-- 定义返回的状态。
pagerOutLine."state":=true;
pagerOutLine."stateCode":=0;
pagerOutLine."message":='';

-- 返回相关数据。
open outline_cursor for select pagerOutLine;
open records_cursor for select * from

(
select * from tbl_test_1000w
where 1=1
and
case when cnd_eq_id is not null then "id"=cnd_eq_id else 1=1 end
and
case when cnd_min_groupid is not null then "groupid">cnd_min_groupid else 1=1 end

and
case when cnd_max_groupid is not null then "groupid"<cnd_max_groupid else 1=1 end

and
case when cnd_begin_create_time is not null then "create_time">cnd_begin_create_time else 1=1 end
and
case when cnd_end_create_time is not null then "create_time"< cnd_end_create_time else 1=1 end
)  tbl_middle
 limit pagerOutLine."pageSize" offset pagerOutLine."beginIndex";


-- 返回数据
return next outline_cursor;
return next records_cursor;

end;

$BODY$ LANGUAGE plpgsql volatile;


/***
*
* 测试用分页存储过程,原始版本,不用cte等等特性。
*
***/
CREATE OR REPLACE FUNCTION public.test_case_search_pager_origin(
	in pageindex integer,
	in pagesize integer,
	cnd_eq_id integer,
	cnd_min_groupid integer,
	cnd_max_groupid integer,
	cnd_begin_create_time timestamp without time zone,
	cnd_end_create_time timestamp without time zone,
	outline_cursor refcursor,
	records_cursor refcursor)
    RETURNS setof refcursor
AS $BODY$
declare pagerOutLine sys_type_pager_outline;
declare totalSize integer;
declare tmpStr varchar(400);
begin


-- 首先获取记录总数

select count(*) into totalSize from
(
select * from tbl_test_1000w
where 1=1
and
case when cnd_eq_id is not null then "id"=cnd_eq_id else 1=1 end
and
case when cnd_min_groupid is not null then "groupid">cnd_min_groupid else 1=1 end

and
case when cnd_max_groupid is not null then "groupid"<cnd_max_groupid else 1=1 end

and
case when cnd_begin_create_time is not null then "create_time">cnd_begin_create_time else 1=1 end
and
case when cnd_end_create_time is not null then "create_time"< cnd_end_create_time else 1=1 end
) tbl_middle
;


-- 然后计算beginIndex,totalPages
pagerOutLine:=sys_func_cal_pager(pageIndex,pageSize,totalSize);
-- raise notice '好了,看看pagerOutline的数据:';
-- raise notice '看看pagerOutLine里面的数据:%,真奇怪,那么,totalSize 是:%',pagerOutLine,totalSize;
-- 定义返回的状态。
pagerOutLine."state":=true;
pagerOutLine."stateCode":=0;
pagerOutLine."message":='';

-- 返回相关数据。
open outline_cursor for select pagerOutLine;
open records_cursor for select * from

(
select * from tbl_test_1000w
where 1=1
and
case when cnd_eq_id is not null then "id"=cnd_eq_id else 1=1 end
and
case when cnd_min_groupid is not null then "groupid">cnd_min_groupid else 1=1 end

and
case when cnd_max_groupid is not null then "groupid"<cnd_max_groupid else 1=1 end

and
case when cnd_begin_create_time is not null then "create_time">cnd_begin_create_time else 1=1 end
and
case when cnd_end_create_time is not null then "create_time"< cnd_end_create_time else 1=1 end
)  tbl_middle
 limit pagerOutLine."pageSize" offset pagerOutLine."beginIndex";


-- 返回数据
return next outline_cursor;
return next records_cursor;

end;

$BODY$ LANGUAGE plpgsql volatile;
先测试1000w条记录的数据库的读取时间…
首先,用两个ssh连接到阿里云服务器。。嗯,每个窗口分别准备一个命令:
-- 每一秒绘制一次内存使用情况,持续60次。采用mb单位显示。
vmstat 1 60 -S M
以及:
-- 列出所有postgres用户持有的进程,每次检测间隔1s,批次运行模式方便监测,对了 -c表示要显示完整的命令。
top -b -c  -d 1   -U postgres
如下图:


然后准备一段调用代码:
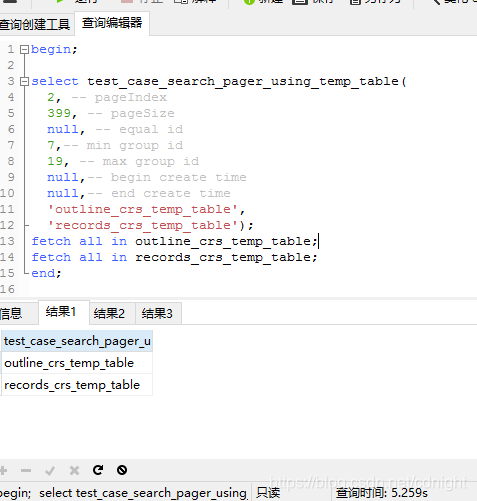
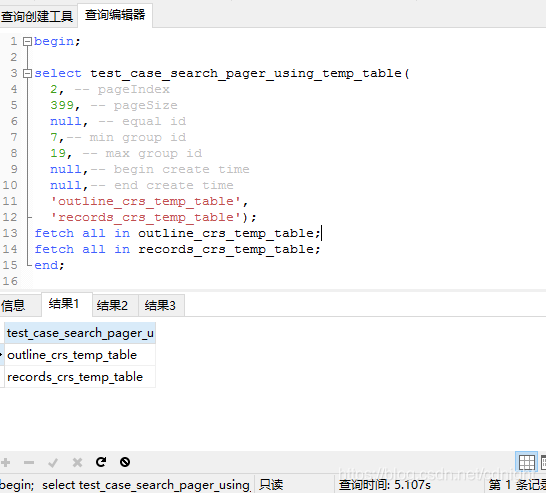
begin;

select test_case_search_pager_using_temp_table(
	2, -- pageIndex
	399, -- pageSize
	null, -- equal id
	7,-- min group id
	19, -- max group id
	null,-- begin create time
	null,-- end create time
	'outline_crs_temp_table',
	'records_crs_temp_table');
fetch all in outline_crs_temp_table;
fetch all in records_crs_temp_table;
end;
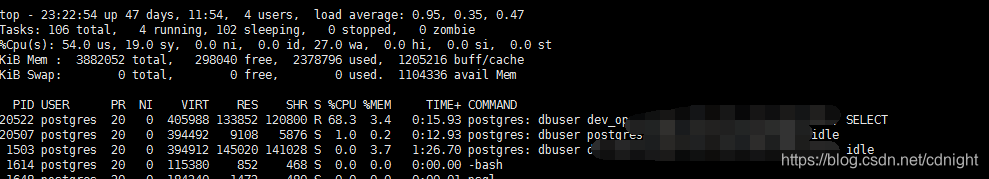
然后,先执行top和vmstat进行监测,再执行sql代码,你会发现如下结果:
1000w的排序足足用了5秒多,搞不好会上6秒的。。。嗯。。。。
然后,查看监测情况:
有一段时间,内存是急剧消耗的,最低空闲内存降到115mb ,
而cpu方面的 监测图例有:
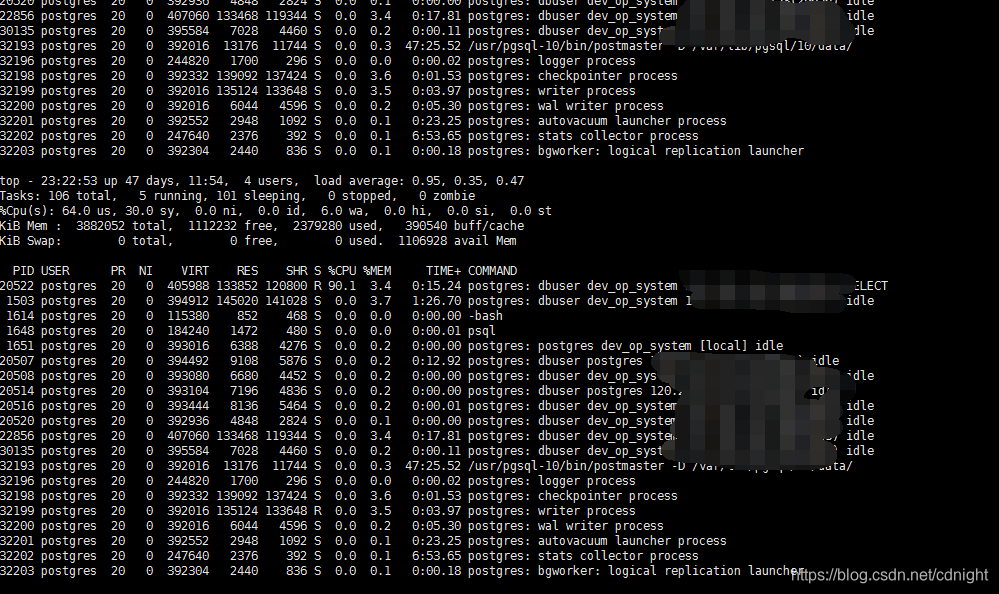
又多又杂的跟踪,很难用肉眼来判断。。
而我们注意到,20522这个pid似乎是用得最多,压根就是我们执行的pid,于是,我们可以直接改改命令,添加pid指定,方便监控。
改为:
-- 注意,-U -p这些没办法同时使用。。
top -b -c  -d 1    -p 20522
然后再尝试一次。。
得到结果:
procs -----------memory---------- ---swap-- -----io---- -system-- ------cpu-----
 r  b   swpd   free   buff  cache   si   so    bi    bo   in   cs us sy id wa st
 4  0      0   1060      7    400    0    0    12    46    9   10  2  1 96  0  0
 0  0      0   1060      7    400    0    0     0    40  369 1008  1  0 99  0  0
 0  0      0   1059      7    400    0    0     0    76  388 1042  2  2 96  0  0
14  0      0    971      7    489    0    0 65048   240  783 1033 18  7 74  1  0
 1  0      0    612      7    848    0    0 252456 58000 1781  738 70 29  0  1  0
 2  0      0    296      7   1164    0    0 222092 114824 1634  815 62 25  0 13  0
 4  0      0    130      7   1330    0    0 62176 114832 1571  834 73 21  0  6  0
 3  0      0    103      1   1172    0    0     4    40 1400  727 65 35  0  0  0
 1  0      0   1094      1    371    0    0    24   192 1161  823 29 51 19  1  0
 4  0      0   1090      1    375    0    0  4712    52  458 1083  2  1 85 12  0
而top的结果是:
  PID USER      PR  NI    VIRT    RES    SHR S %CPU %MEM     TIME+ COMMAND
20522 postgres  20   0  405988 133680 120628 S  0.0  3.4   0:18.31 postgres: dbuser dev_op_system xxx.xxxxx.xxxx.xxxx(29661) idle

top - 23:30:16 up 47 days, 12:01,  4 users,  load average: 0.10, 0.72, 0.68
Tasks:   1 total,   0 running,   1 sleeping,   0 stopped,   0 zombie
%Cpu(s):  1.0 us,  1.0 sy,  0.0 ni, 98.0 id,  0.0 wa,  0.0 hi,  0.0 si,  0.0 st
KiB Mem :  3882052 total,  1085684 free,  2378848 used,   417520 buff/cache
KiB Swap:        0 total,        0 free,        0 used.  1107460 avail Mem

  PID USER      PR  NI    VIRT    RES    SHR S %CPU %MEM     TIME+ COMMAND
20522 postgres  20   0  405988 133680 120628 S  0.0  3.4   0:18.31 postgres: dbuser dev_op_system xxx.xxxxx.xxxx.xxxx(29661) idle

top - 23:30:17 up 47 days, 12:01,  4 users,  load average: 0.09, 0.71, 0.68
Tasks:   1 total,   1 running,   0 sleeping,   0 stopped,   0 zombie
%Cpu(s):  5.9 us,  2.9 sy,  0.0 ni, 91.2 id,  0.0 wa,  0.0 hi,  0.0 si,  0.0 st
KiB Mem :  3882052 total,  1085684 free,  2378848 used,   417520 buff/cache
KiB Swap:        0 total,        0 free,        0 used.  1107460 avail Mem

  PID USER      PR  NI    VIRT    RES    SHR S %CPU %MEM     TIME+ COMMAND
20522 postgres  20   0  405988 133940 120888 R  4.0  3.5   0:18.35 postgres: dbuser dev_op_system xxx.xxxxx.xxxx.xxxx(29661) SELECT

top - 23:30:18 up 47 days, 12:01,  4 users,  load average: 0.09, 0.71, 0.68
Tasks:   1 total,   1 running,   0 sleeping,   0 stopped,   0 zombie
%Cpu(s): 69.7 us, 28.3 sy,  0.0 ni,  0.0 id,  2.0 wa,  0.0 hi,  0.0 si,  0.0 st
KiB Mem :  3882052 total,   697940 free,  2378356 used,   805756 buff/cache
KiB Swap:        0 total,        0 free,        0 used.  1106284 avail Mem

  PID USER      PR  NI    VIRT    RES    SHR S %CPU %MEM     TIME+ COMMAND
20522 postgres  20   0  405988 133940 120888 R 96.0  3.5   0:19.31 postgres: dbuser dev_op_system xxx.xxxxx.xxxx.xxxx(29661) SELECT

top - 23:30:19 up 47 days, 12:01,  4 users,  load average: 0.09, 0.71, 0.68
Tasks:   1 total,   1 running,   0 sleeping,   0 stopped,   0 zombie
%Cpu(s): 66.0 us, 26.0 sy,  0.0 ni,  0.0 id,  8.0 wa,  0.0 hi,  0.0 si,  0.0 st
KiB Mem :  3882052 total,   697940 free,  2378356 used,   805756 buff/cache
KiB Swap:        0 total,        0 free,        0 used.  1106284 avail Mem

  PID USER      PR  NI    VIRT    RES    SHR S %CPU %MEM     TIME+ COMMAND
20522 postgres  20   0  405988 133940 120888 R 88.1  3.5   0:20.20 postgres: dbuser dev_op_system xxx.xxxxx.xxxx.xxxx(29661) SELECT

top - 23:30:20 up 47 days, 12:01,  4 users,  load average: 0.09, 0.71, 0.68
Tasks:   1 total,   1 running,   0 sleeping,   0 stopped,   0 zombie
%Cpu(s): 71.0 us, 23.0 sy,  0.0 ni,  0.0 id,  6.0 wa,  0.0 hi,  0.0 si,  0.0 st
KiB Mem :  3882052 total,   697940 free,  2378356 used,   805756 buff/cache
KiB Swap:        0 total,        0 free,        0 used.  1106284 avail Mem

  PID USER      PR  NI    VIRT    RES    SHR S %CPU %MEM     TIME+ COMMAND
20522 postgres  20   0  405988 133940 120888 R 88.0  3.5   0:21.08 postgres: dbuser dev_op_system xxx.xxxxx.xxxx.xxxx(29661) SELECT

top - 23:30:21 up 47 days, 12:01,  4 users,  load average: 0.09, 0.71, 0.68
Tasks:   1 total,   1 running,   0 sleeping,   0 stopped,   0 zombie
%Cpu(s): 67.6 us, 27.5 sy,  0.0 ni,  0.0 id,  4.9 wa,  0.0 hi,  0.0 si,  0.0 st
KiB Mem :  3882052 total,   125756 free,  2444088 used,  1312208 buff/cache
KiB Swap:        0 total,        0 free,        0 used.  1037680 avail Mem

  PID USER      PR  NI    VIRT    RES    SHR S %CPU %MEM     TIME+ COMMAND
20522 postgres  20   0  478612 199908 120892 R 91.1  5.1   0:22.00 postgres: dbuser dev_op_system xxx.xxxxx.xxxx.xxxx(29661) SELECT

top - 23:30:22 up 47 days, 12:01,  4 users,  load average: 0.96, 0.88, 0.73
Tasks:   1 total,   0 running,   1 sleeping,   0 stopped,   0 zombie
%Cpu(s): 38.4 us, 60.6 sy,  0.0 ni,  1.0 id,  0.0 wa,  0.0 hi,  0.0 si,  0.0 st
KiB Mem :  3882052 total,   125756 free,  2444088 used,  1312208 buff/cache
KiB Swap:        0 total,        0 free,        0 used.  1037680 avail Mem

  PID USER      PR  NI    VIRT    RES    SHR S %CPU %MEM     TIME+ COMMAND
20522 postgres  20   0  405972 133928 120892 S 88.0  3.4   0:22.88 postgres: dbuser dev_op_system xxx.xxxxx.xxxx.xxxx(29661) idle

top - 23:30:23 up 47 days, 12:01,  4 users,  load average: 0.96, 0.88, 0.73
Tasks:   1 total,   0 running,   1 sleeping,   0 stopped,   0 zombie
%Cpu(s):  2.0 us,  1.0 sy,  0.0 ni, 84.2 id, 12.9 wa,  0.0 hi,  0.0 si,  0.0 st
KiB Mem :  3882052 total,   125756 free,  2444088 used,  1312208 buff/cache
KiB Swap:        0 total,        0 free,        0 used.  1037680 avail Mem

  PID USER      PR  NI    VIRT    RES    SHR S %CPU %MEM     TIME+ COMMAND
20522 postgres  20   0  405972 133928 120892 S  0.0  3.4   0:22.88 postgres: dbuser dev_op_system xxx.xxxxx.xxxx.xxxx(29661) idle
嗯,临时表的耗时是5秒以上。。。
下面来看看cte的,两次查询,不用临时表,看看效率。
测试代码:
begin;
-- select test_case_search_pager_using_temp_table(
select test_case_search_pager_using_temp_table(
	2, -- pageIndex
	399, -- pageSize
	null, -- equal id
	7,-- min group id
	19, -- max group id
	null,-- begin create time
	null,-- end create time
	'outline_crs_temp_table',
	'records_crs_temp_table');
fetch all in outline_crs_temp_table;
fetch all in records_crs_temp_table;
end;
其他跟之前的一样。
可以看到:
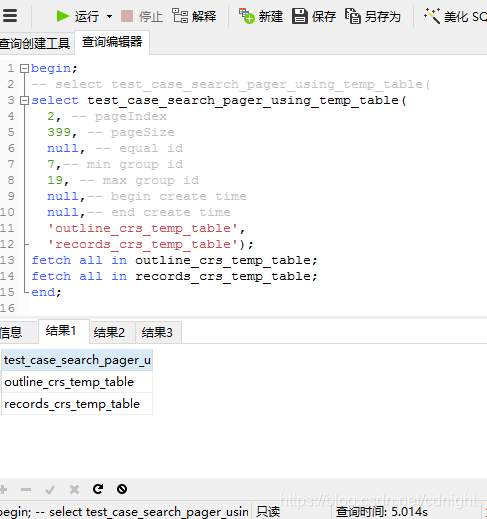
还是5秒多,那么看看其他结果:
procs -----------memory---------- ---swap-- -----io---- -system-- ------cpu-----
 r  b   swpd   free   buff  cache   si   so    bi    bo   in   cs us sy id wa st
 5  0      0   1125      0    342    0    0    13    47    9    0  2  1 96  0  0
 0  0      0   1124      0    342    0    0     0   116  419 1000  4  2 93  1  0
 0  0      0   1124      0    342    0    0     0    40  341  976  1  1 98  0  0
 0  0      0   1124      0    342    0    0     0    72  374 1013  2  1 97  0  0
 0  0      0   1124      0    342    0    0     0    40  361  994  1  0 99  0  0
 3  1      0   1041      0    426    0    0 61536    56  712  992 16  6 78  0  0
 1  0      0    670      0    797    0    0 261788 53388 1708  731 71 28  0  1  0
 1  0      0    321      0   1146    0    0 242284 106792 1746  804 69 27  0  4  0
 1  0      0    167      0   1300    0    0 63980 113120 1334  934 58 19  0 23  0
 2  0      0    145      0   1105    0    0     0    92 1362  743 65 35  0  0  0
 0  0      0   1129      0    337    0    0   256    48 1057  789 27 45 27  0  0
 0  0      0   1130      0    337    0    0     0    40  350  966  2  0 98  0  0
 0  0      0   1129      0    337    0    0     0   140  349  954  2  1 97  0  0
 0  0      0   1130      0    337    0    0   668    40  373  986  1  0 98  1  0
 0  0      0   1129      0    338    0    0   248    40  372 1007  2  1 97  0  0
 0  0      0   1129      0    338    0    0     0    40  331  958  1  0 99  0  0
  PID USER      PR  NI    VIRT    RES    SHR S %CPU %MEM     TIME+ COMMAND
20522 postgres  20   0  406156 135212 121984 S  0.0  3.5   0:55.59 postgres: dbuser dev_op_system xxx.xxxxx.xxxx.xxxx(29661) idle

top - 23:52:44 up 47 days, 12:23,  4 users,  load average: 0.05, 0.46, 0.62
Tasks:   1 total,   0 running,   1 sleeping,   0 stopped,   0 zombie
%Cpu(s):  1.0 us,  0.0 sy,  0.0 ni, 99.0 id,  0.0 wa,  0.0 hi,  0.0 si,  0.0 st
KiB Mem :  3882052 total,  1151460 free,  2379272 used,   351320 buff/cache
KiB Swap:        0 total,        0 free,        0 used.  1120732 avail Mem

  PID USER      PR  NI    VIRT    RES    SHR S %CPU %MEM     TIME+ COMMAND
20522 postgres  20   0  406156 135212 121984 S  0.0  3.5   0:55.59 postgres: dbuser dev_op_system xxx.xxxxx.xxxx.xxxx(29661) idle

top - 23:52:45 up 47 days, 12:23,  4 users,  load average: 0.05, 0.46, 0.62
Tasks:   1 total,   1 running,   0 sleeping,   0 stopped,   0 zombie
%Cpu(s): 15.0 us,  6.0 sy,  0.0 ni, 79.0 id,  0.0 wa,  0.0 hi,  0.0 si,  0.0 st
KiB Mem :  3882052 total,  1151460 free,  2379272 used,   351320 buff/cache
KiB Swap:        0 total,        0 free,        0 used.  1120732 avail Mem

  PID USER      PR  NI    VIRT    RES    SHR S %CPU %MEM     TIME+ COMMAND
20522 postgres  20   0  406156 135212 121984 R 18.0  3.5   0:55.77 postgres: dbuser dev_op_system xxx.xxxxx.xxxx.xxxx(29661) SELECT

top - 23:52:46 up 47 days, 12:24,  4 users,  load average: 0.05, 0.46, 0.62
Tasks:   1 total,   1 running,   0 sleeping,   0 stopped,   0 zombie
%Cpu(s): 71.0 us, 28.0 sy,  0.0 ni,  0.0 id,  1.0 wa,  0.0 hi,  0.0 si,  0.0 st
KiB Mem :  3882052 total,   693076 free,  2378228 used,   810748 buff/cache
KiB Swap:        0 total,        0 free,        0 used.  1106416 avail Mem

  PID USER      PR  NI    VIRT    RES    SHR S %CPU %MEM     TIME+ COMMAND
20522 postgres  20   0  406156 135212 121984 R 97.0  3.5   0:56.75 postgres: dbuser dev_op_system xxx.xxxxx.xxxx.xxxx(29661) SELECT

top - 23:52:47 up 47 days, 12:24,  4 users,  load average: 0.21, 0.48, 0.63
Tasks:   1 total,   1 running,   0 sleeping,   0 stopped,   0 zombie
%Cpu(s): 69.0 us, 27.0 sy,  0.0 ni,  0.0 id,  4.0 wa,  0.0 hi,  0.0 si,  0.0 st
KiB Mem :  3882052 total,   693076 free,  2378228 used,   810748 buff/cache
KiB Swap:        0 total,        0 free,        0 used.  1106416 avail Mem

  PID USER      PR  NI    VIRT    RES    SHR S %CPU %MEM     TIME+ COMMAND
20522 postgres  20   0  406156 135212 121984 R 93.0  3.5   0:57.68 postgres: dbuser dev_op_system xxx.xxxxx.xxxx.xxxx(29661) SELECT

top - 23:52:48 up 47 days, 12:24,  4 users,  load average: 0.21, 0.48, 0.63
Tasks:   1 total,   1 running,   0 sleeping,   0 stopped,   0 zombie
%Cpu(s): 59.0 us, 18.0 sy,  0.0 ni,  0.0 id, 23.0 wa,  0.0 hi,  0.0 si,  0.0 st
KiB Mem :  3882052 total,   693076 free,  2378228 used,   810748 buff/cache
KiB Swap:        0 total,        0 free,        0 used.  1106416 avail Mem

  PID USER      PR  NI    VIRT    RES    SHR S %CPU %MEM     TIME+ COMMAND
20522 postgres  20   0  406156 135212 121984 R 73.3  3.5   0:58.42 postgres: dbuser dev_op_system xxx.xxxxx.xxxx.xxxx(29661) SELECT

top - 23:52:49 up 47 days, 12:24,  4 users,  load average: 0.21, 0.48, 0.63
Tasks:   1 total,   1 running,   0 sleeping,   0 stopped,   0 zombie
%Cpu(s): 65.3 us, 34.7 sy,  0.0 ni,  0.0 id,  0.0 wa,  0.0 hi,  0.0 si,  0.0 st
KiB Mem :  3882052 total,   101368 free,  2591208 used,  1189476 buff/cache
KiB Swap:        0 total,        0 free,        0 used.   890824 avail Mem

  PID USER      PR  NI    VIRT    RES    SHR S %CPU %MEM     TIME+ COMMAND
20522 postgres  20   0  626256 347796 122140 R 97.0  9.0   0:59.39 postgres: dbuser dev_op_system xxx.xxxxx.xxxx.xxxx(29661) SELECT

top - 23:52:50 up 47 days, 12:24,  4 users,  load average: 0.21, 0.48, 0.63
Tasks:   1 total,   0 running,   1 sleeping,   0 stopped,   0 zombie
%Cpu(s): 28.3 us, 46.5 sy,  0.0 ni, 25.3 id,  0.0 wa,  0.0 hi,  0.0 si,  0.0 st
KiB Mem :  3882052 total,   101368 free,  2591208 used,  1189476 buff/cache
KiB Swap:        0 total,        0 free,        0 used.   890824 avail Mem

  PID USER      PR  NI    VIRT    RES    SHR S %CPU %MEM     TIME+ COMMAND
20522 postgres  20   0  406156 135368 122140 S 65.3  3.5   1:00.05 postgres: dbuser dev_op_system xxx.xxxxx.xxxx.xxxx(29661) idle

top - 23:52:51 up 47 days, 12:24,  4 users,  load average: 0.21, 0.48, 0.63
Tasks:   1 total,   0 running,   1 sleeping,   0 stopped,   0 zombie
%Cpu(s):  2.0 us,  0.0 sy,  0.0 ni, 98.0 id,  0.0 wa,  0.0 hi,  0.0 si,  0.0 st
KiB Mem :  3882052 total,   101368 free,  2591208 used,  1189476 buff/cache
KiB Swap:        0 total,        0 free,        0 used.   890824 avail Mem

  PID USER      PR  NI    VIRT    RES    SHR S %CPU %MEM     TIME+ COMMAND
20522 postgres  20   0  406156 135368 122140 S  0.0  3.5   1:00.05 postgres: dbuser dev_op_system xxx.xxxxx.xxxx.xxxx(29661) idle
差距没多大啊。。
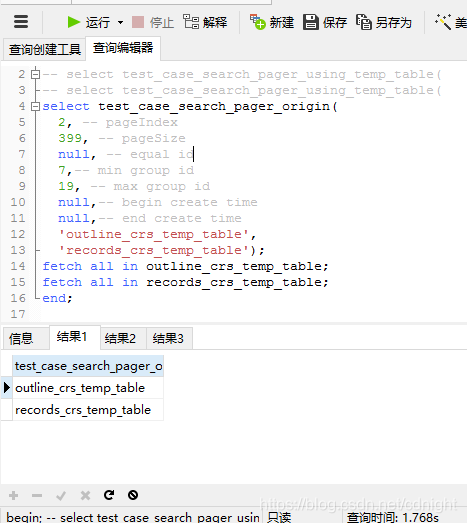
下面看看不用cte的。。
begin;
-- select test_case_search_pager_using_temp_table(
-- select test_case_search_pager_using_temp_table(
select test_case_search_pager_origin(
	2, -- pageIndex
	399, -- pageSize
	null, -- equal id
	7,-- min group id
	19, -- max group id
	null,-- begin create time
	null,-- end create time
	'outline_crs_temp_table',
	'records_crs_temp_table');
fetch all in outline_crs_temp_table;
fetch all in records_crs_temp_table;
end;
然后测试:
procs -----------memory---------- ---swap-- -----io---- -system-- ------cpu-----
 r  b   swpd   free   buff  cache   si   so    bi    bo   in   cs us sy id wa st
 4  0      0    456      4   1006    0    0    13    47    9    0  2  1 96  0  0
 0  0      0    455      4   1006    0    0     0    40  389 1066  1  1 98  0  0
 0  0      0    456      4   1006    0    0     0    52  368 1022  1  1 98  0  0
 2  0      0    456      4   1006    0    0     0    40  291  924  1  1 98  0  0
 0  0      0    456      4   1006    0    0     0   100  346  991  1  0 99  0  0
 0  0      0    456      4   1006    0    0     0    40  304  942  1  1 98  0  0
 0  0      0    455      4   1006    0    0     0    40  361  976  2  1 97  0  0
 3  0      0    452      4   1008    0    0  1892     0 1230 3788 48 32 17  3  0
 1  0      0    451      4   1008    0    0     0    80 1420 4396 60 40  0  0  0
 1  0      0    452      4   1008    0    0     0   108 1406 4228 62 38  0  0  0
 9  0      0    446      4   1009    0    0     0   112 1341 3003 68 32  0  0  0
13  0      0    447      4   1009    0    0     0    40 1272 1069 83 17  0  0  0
 3  0      0    452      4   1008    0    0     0    40 1369 3571 64 36  0  0  0
 2  0      0    452      4   1008    0    0     0    40 1390 4355 59 41  0  0  0
 1  0      0    453      4   1008    0    0     0    40 1406 4523 56 44  0  0  0
 4  0      0    452      4   1008    0    0   148   176 1406 4359 58 42  0  0  0
  PID USER      PR  NI    VIRT    RES    SHR S %CPU %MEM     TIME+ COMMAND
20522 postgres  20   0  409836 139740 125028 S  0.0  3.6   1:01.77 postgres: dbuser dev_op_system xxx.xxxxx.xxxx.xxxx(29661) idle

top - 23:59:31 up 47 days, 12:30,  4 users,  load average: 1.72, 0.58, 0.56
Tasks:   1 total,   1 running,   0 sleeping,   0 stopped,   0 zombie
%Cpu(s): 80.8 us, 19.2 sy,  0.0 ni,  0.0 id,  0.0 wa,  0.0 hi,  0.0 si,  0.0 st
KiB Mem :  3882052 total,   463120 free,  2381500 used,  1037432 buff/cache
KiB Swap:        0 total,        0 free,        0 used.  1104724 avail Mem

  PID USER      PR  NI    VIRT    RES    SHR S %CPU %MEM     TIME+ COMMAND
20522 postgres  20   0  410172 139740 125028 R 16.0  3.6   1:01.93 postgres: dbuser dev_op_system xxx.xxxxx.xxxx.xxxx(29661) SELECT

top - 23:59:32 up 47 days, 12:30,  4 users,  load average: 1.90, 0.63, 0.58
Tasks:   1 total,   0 running,   1 sleeping,   0 stopped,   0 zombie
%Cpu(s): 79.2 us, 19.8 sy,  0.0 ni,  0.0 id,  0.0 wa,  0.0 hi,  1.0 si,  0.0 st
KiB Mem :  3882052 total,   463096 free,  2381364 used,  1037592 buff/cache
KiB Swap:        0 total,        0 free,        0 used.  1104708 avail Mem

  PID USER      PR  NI    VIRT    RES    SHR S %CPU %MEM     TIME+ COMMAND
20522 postgres  20   0  409836 140176 125464 S 14.0  3.6   1:02.07 postgres: dbuser dev_op_system xxx.xxxxx.xxxx.xxxx(29661) idle

top - 23:59:33 up 47 days, 12:30,  4 users,  load average: 1.90, 0.63, 0.58
Tasks:   1 total,   0 running,   1 sleeping,   0 stopped,   0 zombie
%Cpu(s): 58.0 us, 40.0 sy,  0.0 ni,  0.0 id,  0.0 wa,  0.0 hi,  2.0 si,  0.0 st
KiB Mem :  3882052 total,   463096 free,  2381364 used,  1037592 buff/cache
KiB Swap:        0 total,        0 free,        0 used.  1104708 avail Mem

  PID USER      PR  NI    VIRT    RES    SHR S %CPU %MEM     TIME+ COMMAND
20522 postgres  20   0  409836 140176 125464 S  1.0  3.6   1:02.08 postgres: dbuser dev_op_system xxx.xxxxx.xxxx.xxxx(29661) idle
这里我先解释一下为什么内存会突然之间降低了这么多一直没见恢复的。。。是不是泄露了?
不是的。。因为刚才中间第三个存储过程报错了,结果空闲内存一下子降了这么多。。我也很无奈的。
报错时候执行的在这里:
procs -----------memory---------- ---swap-- -----io---- -system-- ------cpu-----
 r  b   swpd   free   buff  cache   si   so    bi    bo   in   cs us sy id wa st
 4  0      0   1056      3    407    0    0    13    47    9    0  2  1 96  0  0
 0  0      0   1056      3    407    0    0     0    40  359 1004  1  0 99  0  0
 0  0      0   1056      3    407    0    0     0    68  349  994  2  1 97  0  0
 0  0      0   1056      3    407    0    0     0    40  337  979  1  0 99  0  0
10  5      0    866      4    592    0    0 189020   104 1017 1185 27 10 54  9  0
 4  3      0    494      4    964    0    0 380656    60 1727 1230 72 17  0 11  0
 0  0      0    457      4   1005    0    0 42972    40 1048  957 53  7 35  5  0
 0  0      0    457      4   1005    0    0     0    56  347  987  2  1 97  0  0
 0  0      0    457      4   1005    0    0     0    40  316  949  1  1 98  0  0
 0  0      0    457      4   1005    0    0     0   120  319  958  1  0 99  0  0
 0  0      0    457      4   1005    0    0     0    40  323  969  1  1 98  0  0
 0  0      0    457      4   1005    0    0     0    40  324  956  2  0 98  0  0
 0  0      0    457      4   1005    0    0     0    76  309  947  1  1 98  0  0
 0  0      0    457      4   1005    0    0     0    40  320  955  1  2 97  0  0
 0  0      0    457      4   1005    0    0     0    96  324  963  0  0 100  0  0
 0  0      0    458      4   1005    0    0     0    40  343  978  2  1 97  0  0
 0  0      0    458      4   1005    0    0     0    40  348  973  1  1 98  0  0
 0  0      0    458      4   1005    0    0     0    40  349  989  1  0 99  0  0
从一千多降到460m左右。。不见恢复。。
好了,说说第三次的结论。。
1.7s。。。。额。。是临时表还有cte的三分一消耗。。而且,内存不减,cpu消耗也不高。这是开玩笑嘛?
下面来调整搜索条件还有先进行一下分析看看结果。
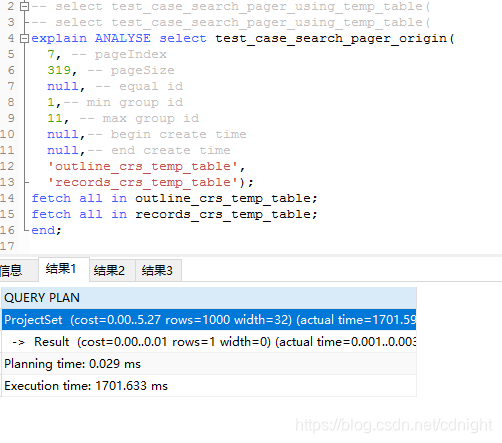
好了,调整后还是分析还是认为1.7s,那么执行实际情况,监测:
begin;
-- select test_case_search_pager_using_temp_table(
-- select test_case_search_pager_using_temp_table(
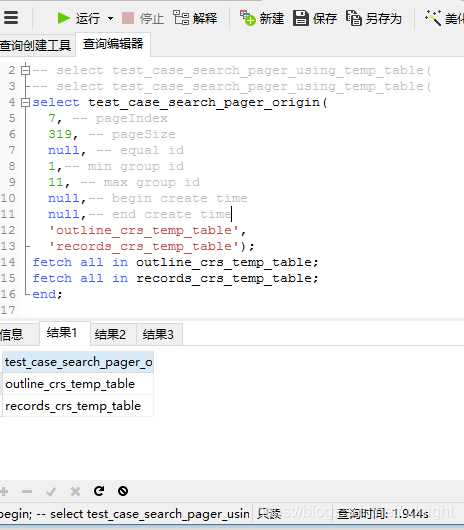
select test_case_search_pager_origin(
7, -- pageIndex
319, -- pageSize
null, -- equal id
1,-- min group id
11, -- max group id
null,-- begin create time
null,-- end create time
'outline_crs_temp_table',
'records_crs_temp_table');
fetch all in outline_crs_temp_table;
fetch all in records_crs_temp_table;
end;
结果:
两秒钟!结果还是远远低于cte还有临时表!
其他表现:
 r  b   swpd   free   buff  cache   si   so    bi    bo   in   cs us sy id wa st
 6  0      0    445      7   1011    0    0    13    47    9    1  2  1 96  0  0
 1  0      0    445      7   1011    0    0     0    40 1389 4451 62 38  0  0  0
 3  0      0    445      7   1011    0    0     0   148 1393 4545 58 42  0  0  0
 3  0      0    445      7   1011    0    0     0    40 1383 4555 58 42  0  0  0
 2  0      0    445      7   1011    0    0     0    40 1382 4518 58 42  0  0  0
 4  0      0    440      7   1011    0    0     0   116 1256 2036 79 21  0  0  0
 6  0      0    439      7   1011    0    0     0    40 1250 1078 87 13  0  0  0
 2  0      0    445      7   1011    0    0     0   124 1373 4330 62 38  0  0  0
 6  0      0    445      7   1011    0    0     0    92 1392 4516 59 41  0  0  0
 1  0      0    445      7   1011    0    0     0     0 1370 4343 62 38  0  0  0
 4  0      0    445      7   1011    0    0     0    40 1344 2263 83 17  0  0  0
 3  0      0    446      7   1011    0    0     0    40 1383 4305 57 43  0  0  0
 2  0      0    446      7   1011    0    0     0    40 1383 4315 57 43  0  0  0
top - 00:07:18 up 47 days, 12:38,  4 users,  load average: 4.03, 1.81, 1.09
Tasks:   1 total,   0 running,   1 sleeping,   0 stopped,   0 zombie
%Cpu(s): 58.6 us, 40.4 sy,  0.0 ni,  0.0 id,  0.0 wa,  0.0 hi,  1.0 si,  0.0 st
KiB Mem :  3882052 total,   456592 free,  2382092 used,  1043368 buff/cache
KiB Swap:        0 total,        0 free,        0 used.  1102968 avail Mem

  PID USER      PR  NI    VIRT    RES    SHR S %CPU %MEM     TIME+ COMMAND
20522 postgres  20   0  410084 141056 125984 S  0.0  3.6   1:02.44 postgres: dbuser dev_op_system xxx.xxxxx.xxxx.xxxx(29661) idle

top - 00:07:19 up 47 days, 12:38,  4 users,  load average: 4.03, 1.81, 1.09
Tasks:   1 total,   1 running,   0 sleeping,   0 stopped,   0 zombie
%Cpu(s): 72.3 us, 26.7 sy,  0.0 ni,  0.0 id,  0.0 wa,  0.0 hi,  1.0 si,  0.0 st
KiB Mem :  3882052 total,   456592 free,  2382092 used,  1043368 buff/cache
KiB Swap:        0 total,        0 free,        0 used.  1102968 avail Mem

  PID USER      PR  NI    VIRT    RES    SHR S %CPU %MEM     TIME+ COMMAND
20522 postgres  20   0  410420 141320 126108 R  8.9  3.6   1:02.53 postgres: dbuser dev_op_system xxx.xxxxx.xxxx.xxxx(29661) SELECT

top - 00:07:20 up 47 days, 12:38,  4 users,  load average: 4.03, 1.81, 1.09
Tasks:   1 total,   1 running,   0 sleeping,   0 stopped,   0 zombie
%Cpu(s): 86.0 us, 14.0 sy,  0.0 ni,  0.0 id,  0.0 wa,  0.0 hi,  0.0 si,  0.0 st
KiB Mem :  3882052 total,   456592 free,  2382092 used,  1043368 buff/cache
KiB Swap:        0 total,        0 free,        0 used.  1102968 avail Mem

  PID USER      PR  NI    VIRT    RES    SHR S %CPU %MEM     TIME+ COMMAND
20522 postgres  20   0  410420 141320 126108 R 18.0  3.6   1:02.71 postgres: dbuser dev_op_system xxx.xxxxx.xxxx.xxxx(29661) SELECT

top - 00:07:21 up 47 days, 12:38,  4 users,  load average: 4.03, 1.81, 1.09
Tasks:   1 total,   0 running,   1 sleeping,   0 stopped,   0 zombie
%Cpu(s): 68.6 us, 30.4 sy,  0.0 ni,  0.0 id,  0.0 wa,  0.0 hi,  1.0 si,  0.0 st
KiB Mem :  3882052 total,   456460 free,  2382068 used,  1043524 buff/cache
KiB Swap:        0 total,        0 free,        0 used.  1102844 avail Mem

  PID USER      PR  NI    VIRT    RES    SHR S %CPU %MEM     TIME+ COMMAND
20522 postgres  20   0  410084 141396 126184 S  6.9  3.6   1:02.78 postgres: dbuser dev_op_system xxx.xxxxx.xxxx.xxxx(29661) idle

top - 00:07:22 up 47 days, 12:38,  4 users,  load average: 4.43, 1.93, 1.14
Tasks:   1 total,   0 running,   1 sleeping,   0 stopped,   0 zombie
%Cpu(s): 59.6 us, 39.4 sy,  0.0 ni,  0.0 id,  0.0 wa,  0.0 hi,  1.0 si,  0.0 st
KiB Mem :  3882052 total,   456460 free,  2382068 used,  1043524 buff/cache
KiB Swap:        0 total,        0 free,        0 used.  1102844 avail Mem
内存消耗很少,不到20%的cpu利用率。。额,我这种渣机器竟然能够拖动千万级别表的除了主键以外其他地方没有加索引的任意条件查询!
这个简直是逆天了。
而使用临时表还有cte的。。。感觉就应了一句话: 特性一时爽,全家火葬场。。。
100w及10w级别的已经不想测试了,因为。。。1000w级别的数据也能查询这么快了。。嗯,我何必再跟小儿科斤斤计较。。