今天看@褚霸的博客,看到了几篇关于pagecache、slab的几篇好文章,转一下!
Linux下对文件的访问和设备的访问通常会被cache起来加快访问速度,这个是系统的默认行为。 而cache需要耗费我们的内存,虽然这个内存最后可以通过echo 3>/proc/sys/vm/drop_caches这样的命令来主动释放。但是有时候我们还是需要理解谁消耗了我们的内存。
我们来先了解下内存的使用情况:

total used free shared buffers cached |
Mem: 24676836 626568 24050268 0 30884 508312 |
-/+ buffers/cache: 87372 24589464 |
有了伟大的systemtap, 我们可以用stap脚本来了解谁在消耗我们的cache了:
dev=2, devname=N/A, ino=0, index=2975, nrpages=1777 |
dev=2, devname=N/A, ino=0, index=3399, nrpages=2594 |
dev=2, devname=N/A, ino=0, index=3034, nrpages=1778 |
dev=2, devname=N/A, ino=0, index=3618, nrpages=2595 |
dev=2, devname=N/A, ino=0, index=1694, nrpages=106 |
dev=2, devname=N/A, ino=0, index=1703, nrpages=107 |
dev=2, devname=N/A, ino=0, index=1810, nrpages=210 |
dev=2, devname=N/A, ino=0, index=1812, nrpages=211 |
这时候我们拷贝个大文件:
[chuba@my031045 ~]$ cp huge_foo.file bar |
dev=8388614, devname=sda6, ino=2399271, index=39393, nrpages=39393 |
dev=8388614, devname=sda6, ino=2399271, index=39394, nrpages=39394 |
dev=8388614, devname=sda6, ino=2399271, index=39395, nrpages=39395 |
dev=8388614, devname=sda6, ino=2399271, index=39396, nrpages=39396 |
dev=8388614, devname=sda6, ino=2399271, index=39397, nrpages=39397 |
dev=8388614, devname=sda6, ino=2399271, index=39398, nrpages=39398 |
dev=8388614, devname=sda6, ino=2399271, index=39399, nrpages=39399 |
dev=8388614, devname=sda6, ino=2399271, index=39400, nrpages=39400 |
dev=8388614, devname=sda6, ino=2399271, index=39401, nrpages=39401 |
dev=8388614, devname=sda6, ino=2399271, index=39402, nrpages=39402 |
dev=8388614, devname=sda6, ino=2399271, index=39403, nrpages=39403 |
dev=8388614, devname=sda6, ino=2399271, index=39404, nrpages=39404 |
dev=8388614, devname=sda6, ino=2399271, index=39405, nrpages=39405 |
dev=8388614, devname=sda6, ino=2399271, index=39406, nrpages=39406 |
dev=8388614, devname=sda6, ino=2399271, index=39407, nrpages=39407 |
dev=8388614, devname=sda6, ino=2399271, index=39408, nrpages=39408 |
dev=8388614, devname=sda6, ino=2399271, index=39409, nrpages=39409 |
dev=8388614, devname=sda6, ino=2399271, index=39410, nrpages=39410 |
dev=8388614, devname=sda6, ino=2399271, index=39411, nrpages=39411 |
此外加入我们想了解下系统的cache都谁在用呢, 那个文件用到多少页了呢?
我们有个脚本可以做到,这里非常谢谢 子团 让我使用他的代码。
非常清楚的看出来每个inode占用了多少页,用工具转换下就知道哪个文件耗费了多少内存。
点击下载viewcache.stp
另外小TIPS:
从inode到文件名的转换
find / -inum your_inode
从文件名到inode的转换
stat -c “%i” your_filename
或者 ls -i your_filename
我们套用了下就马上知道那个文件占用的cache很多。
[chuba@my031045 ~]$ sudo find / -inum 2399248 |
/home/chuba/kernel-debuginfo-2.6.18-164.el5.x86_64.rpm |
玩的开心。
参考资料:
page cache和buffer cache的区别:
这篇文章总结的最靠谱: http://blog.chinaunix.net/u/1595/showart.php?id=2209511
后记:
linux下有个这样的系统调用可以知道页面的状态:mincore – determine whether pages are resident in memory
同时有人作个脚本fincore更方便大家的使用, 点击下载fincore
后来子团告诉我还有这个工具: https://code.google.com/p/linux-ftools/
vmtouch-系统pagecache查看和操纵器
今天看到dbanote这篇博文介绍的技术清单,里面列到了很多有意思的技术。其中提到了一个小工具vmtouch,主页见这里。
vmtouch – the Virtual Memory Toucher
Portable file system cache diagnostics and control
vmtouch is a tool for learning about and controlling the file system cache of unix and unix-like systems. It is BSD licensed so you can basically do whatever you want with it.
我之前写过不少之类的博文,但是基本都是用systemtap,工具也零碎,现在vmtouch比较系统的把功能整合在一起,源码写的虽然简单,但是用到了还是挺管用的。
顺手贴了下vmtouch的使用:
Example 1
How much of the /bin/ directory is currently in cache?
$ vmtouch /bin/
Files: 92
Directories: 1
Resident Pages: 348/1307 1M/5M 26.6%
Elapsed: 0.003426 seconds
Example 2
How much of big-dataset.txt is currently in memory?
$ vmtouch -v big-dataset.txt
big-dataset.txt
[ ] 0/42116
Files: 1
Directories: 0
Resident Pages: 0/42116 0/164M 0%
Elapsed: 0.005182 seconds
None of it. Now let’s bring part of it into memory with tail:
$ tail -n 10000 big-dataset.txt > /dev/null
Now how much?
$ vmtouch -v big-dataset.txt
big-dataset.txt
[ oOOOOOOO] 4950/42116
Files: 1
Directories: 0
Resident Pages: 4950/42116 19M/164M 11.8%
Elapsed: 0.006706 seconds
vmtouch tells us that 4950 pages at the end of the file are now resident in memory.
Example 3
Let’s bring the rest of big-dataset.txt into memory (pressing enter a few times to illustrate the animated progress bar you will see on your terminal):
$ vmtouch -vt big-dataset.txt
big-dataset.txt
[OOo oOOOOOOO] 6887/42116
[OOOOOOOOo oOOOOOOO] 10631/42116
[OOOOOOOOOOOOOOo oOOOOOOO] 15351/42116
[OOOOOOOOOOOOOOOOOOOOOo oOOOOOOO] 19719/42116
[OOOOOOOOOOOOOOOOOOOOOOOOOOOo oOOOOOOO] 24183/42116
[OOOOOOOOOOOOOOOOOOOOOOOOOOOOOOOOOo oOOOOOOO] 28615/42116
[OOOOOOOOOOOOOOOOOOOOOOOOOOOOOOOOOOOOOo oOOOOOOO] 31415/42116
[OOOOOOOOOOOOOOOOOOOOOOOOOOOOOOOOOOOOOOOOOOOOOo oOOOOOOO] 36775/42116
[OOOOOOOOOOOOOOOOOOOOOOOOOOOOOOOOOOOOOOOOOOOOOOOOOo oOOOOOOO] 39431/42116
[OOOOOOOOOOOOOOOOOOOOOOOOOOOOOOOOOOOOOOOOOOOOOOOOOOOOOOOOOOOO] 42116/42116
Files: 1
Directories: 0
Touched Pages: 42116 (164M)
Elapsed: 12.107 seconds
Example 4
We have 3 big datasets, a.txt, b.txt, and c.txt but only 2 of them will fit in memory at once. If we have a.txt and b.txt in memory but would now like to work with b.txt and c.txt, we could just start loading up c.txt but then our system would evict pages from both a.txt (which we want) and b.txt (which we don’t want).
So let’s give the system a hint and evict a.txt from memory, making room for c.txt:
$ vmtouch -ve a.txt
Evicting a.txt
Files: 1
Directories: 0
Evicted Pages: 42116 (164M)
Elapsed: 0.076824 seconds
Example 5
Daemonise and lock all files in a directory into physical memory:
vmtouch -dl /var/www/htdocs/critical/
BufferedIO和DirectIO混用导致的脏页回写问题
今天曲山同学在线上问道:
我测试发现,如果cp一个文件,然后direct io读这个文件,会消耗很长时间。
我猜测dio不能用page cache,而这个文件cp以后都在cache里面,要强制刷到磁盘,才能读?
我cp这个文件很大,超过256M
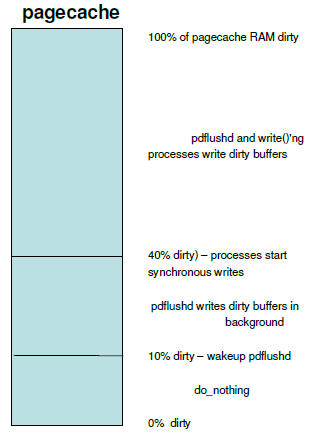
由于数据文件默认是用bufferedio方式打开的,也就是说它的数据是先缓冲在pagecache里面的,写入的数据会导致大量的脏页,而且这部分数据如果内核内存不紧张的话,是一直放在内存里面的的。我们知道directio是直接旁路掉pagecache直接发起设备IO的,也就是说在发起IO之前要保证数据是先落地到介质去,所以如果文件比较大的话,这个时间会比较长。从pagecahce的回写行为我们可以知道,只要脏页的数量不超过总内存的10%, 我们的机器有4G的内存,所以2个100M的文件总共才200M,不会导致writeback发生,我们可以很顺利的观察到这个现象。
有了上面的分析,下面我们来重现下这个问题。以下是我的步骤:
Linux rds064075.sqa.cm4 2.6.32-131.21.1.tb477.el6.x86_64 |
$ sudo sysctl vm.drop_caches=3 |
$ free -m && cat /proc/meminfo |grep -i dirty && time dd if=/dev/urandom of=test.dat count=6144 bs=16384 && free -m && cat /proc/meminfo |grep -i dirty && time ddif=test.dat of=/dev/null count=6144 bs=16384 && free -m && cat /proc/meminfo |grep -i dirty && time dd if=test.dat of=/dev/null count=6144 bs=16384 iflag=direct &&free -m && cat /proc/meminfo |grep -i dirty |
$ free -m && cat /proc/meminfo |grep -i dirty && time dd if=/dev/urandom of=test.dat count=6144 bs=16384 && free -m && cat /proc/meminfo |grep -i dirty && time ddif=test.dat of=/dev/null count=6144 bs=16384 && free -m && cat /proc/meminfo |grep -i dirty && time dd if=test.dat of=/dev/null count=6144 bs=16384 iflag=direct &&free -m && cat /proc/meminfo |grep -i dirty |
total used free shared buffers cached |
Mem: 48262 22800 25461 0 3 42 |
-/+ buffers/cache: 22755 25507 |
100663296 bytes (101 MB) copied, 15.2308 s, 6.6 MB/s |
total used free shared buffers cached |
Mem: 48262 22912 25350 0 3 139 |
-/+ buffers/cache: 22768 25493 |
100663296 bytes (101 MB) copied, 0.028041 s, 3.6 GB/s |
total used free shared buffers cached |
Mem: 48262 22912 25350 0 3 139 |
-/+ buffers/cache: 22768 25493 |
100663296 bytes (101 MB) copied, 0.466601 s, 216 MB/s |
total used free shared buffers cached |
Mem: 48262 22906 25356 0 3 140 |
-/+ buffers/cache: 22762 25500 |
从上面的实验,我们可以看出来我们的文件是101MB左右,脏页用了98544KB内存,在direct方式读后,文件占用的脏页被清洗掉了,脏页变成了80K, 但是这块数据还是留在了pagecache(140-39), 符合我们的预期。
接着我们从源码角度来分析下这个现象,我们知道VFS文件的读是从generic_file_aio_read发起的,而不管具体的文件系统是什么。
在文卿和三百的帮助下,我们不费吹灰之力就找到了源码位置,偷懒的方式如下:
$ stap -L 'kernel.function("generic_file_aio_read")' |
kernel.function("generic_file_aio_read@mm/filemap.c:1331") $iocb:struct kiocb* $iov:struct iovec const* $nr_segs:long unsigned int $pos:loff_t $count:size_t |
准备好emacs,我们来看下读代码的实现:
mm/filemap.c:1331
generic_file_aio_read(struct kiocb *iocb, const struct iovec *iov, |
unsigned long nr_segs, loff_t pos) |
if (filp->f_flags & O_DIRECT) { |
struct address_space *mapping; |
mapping = filp->f_mapping; |
size = i_size_read(inode); |
retval = filemap_write_and_wait_range(mapping, pos, |
pos + iov_length(iov, nr_segs) - 1); |
retval = mapping->a_ops->direct_IO(READ, |
if (retval < 0 || !count || *ppos >= size) { |
源码很清楚的说:在directio方式下打开的文件,先要透过filemap_write_and_wait_range回写数据,才开始后面的IO读流程。
最后一步骤,我们再用stap来确认下我们之前的实验:
probe kernel.function("filemap_write_and_wait_range") { |
if (execname() != "dd") next; |
0xffffffff8110e200 : filemap_write_and_wait_range+0x0/0x90 [kernel] |
0xffffffff8110f278 : generic_file_aio_read+0x498/0x870 [kernel] |
0xffffffff8117323a : do_sync_read+0xfa/0x140 [kernel] |
0xffffffff81173c65 : vfs_read+0xb5/0x1a0 [kernel] |
0xffffffff81173da1 : sys_read+0x51/0x90 [kernel] |
0xffffffff8100b172 : system_call_fastpath+0x16/0x1b [kernel] |
0xffffffff8110e200 : filemap_write_and_wait_range+0x0/0x90 [kernel] |
0xffffffff811acbc8 : __blockdev_direct_IO+0x228/0xc40 [kernel] |
0xffffffff8110e200 : filemap_write_and_wait_range+0x0/0x90 [kernel] |
0xffffffff8110f278 : generic_file_aio_read+0x498/0x870 [kernel] |
0xffffffff8117323a : do_sync_read+0xfa/0x140 [kernel] |
0xffffffff81173c65 : vfs_read+0xb5/0x1a0 [kernel] |
0xffffffff81173da1 : sys_read+0x51/0x90 [kernel] |
0xffffffff8100b172 : system_call_fastpath+0x16/0x1b [kernel] |
0xffffffff8110e200 : filemap_write_and_wait_range+0x0/0x90 [kernel] |
0xffffffff811acbc8 : __blockdev_direct_IO+0x228/0xc40 [kernel] |
filemap_write_and_wait_range的调用栈很清晰的暴露了一切!
