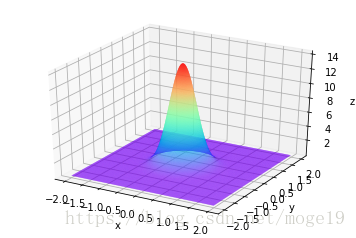
1、用numpy模块实现
import numpy as np
import matplotlib.pyplot as plt
import math
import mpl_toolkits.mplot3d

x, y = np.mgrid[-2:2:0.01, -2:2:0.01]

z=(1/2*math.pi*3**2)*np.exp(-(x**2+y**2)/2*3**2)
ax = plt.subplot(111, projection='3d')
ax.plot_surface(x, y, z, rstride=1, cstride=1, cmap='rainbow', alpha=0.9)#绘面
ax.set_xlabel('x')
ax.set_ylabel('y')
ax.set_zlabel('z')
plt.show()
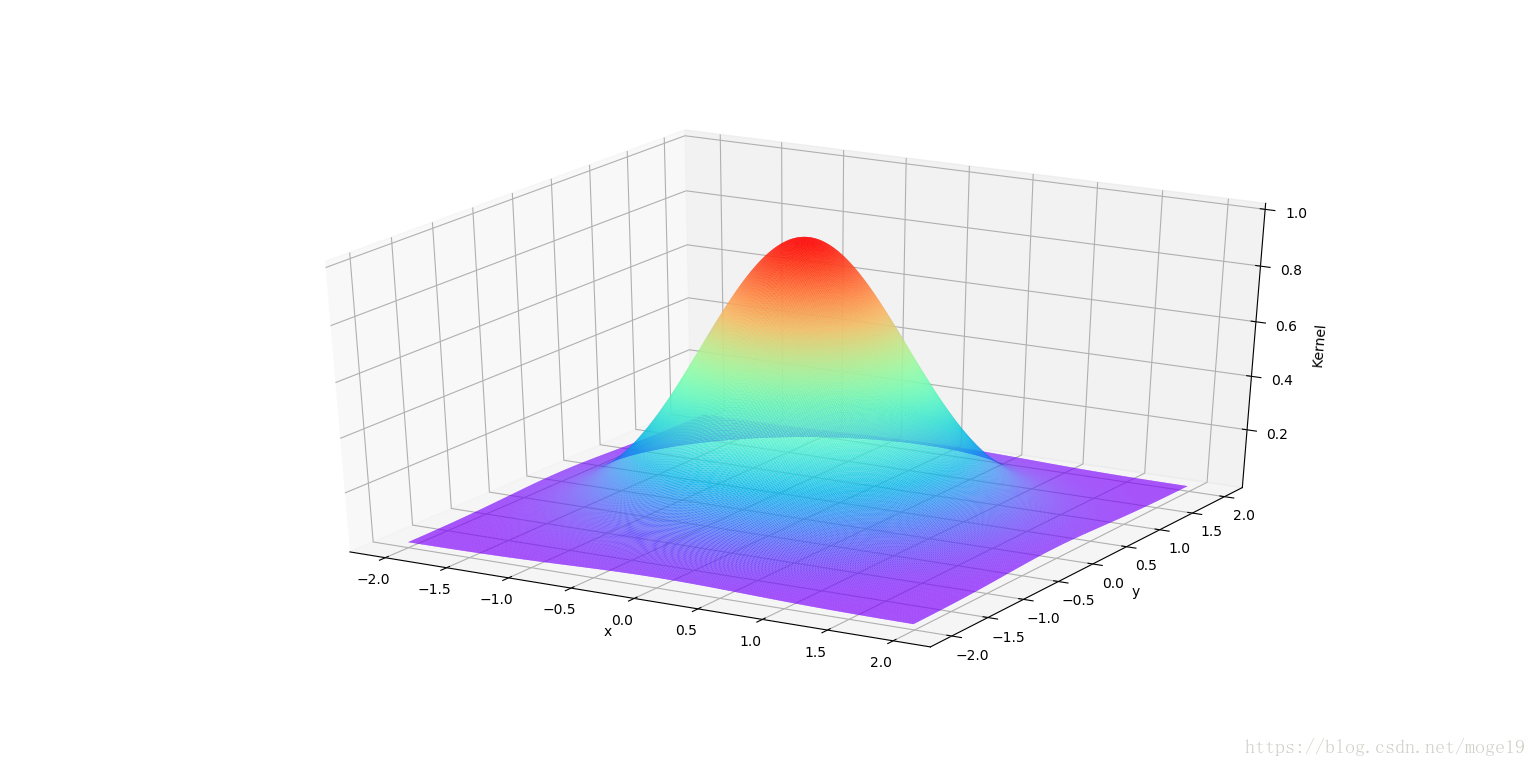
2、用TensorFlow实现
import numpy as np
import matplotlib.pyplot as plt
import math
import mpl_toolkits.mplot3d
import tensorflow as tf
from sklearn import datasets

sess = tf.InteractiveSession()
gamma = tf.constant(-1.0)
x, y = np.mgrid[-2:2:0.01, -2:2:0.01]

x_data = tf.placeholder(shape=[400, 400], dtype=tf.float32)
y_data = tf.placeholder(shape=[400, 400], dtype=tf.float32)

Kernel = tf.exp(tf.multiply(gamma, tf.add((x_data*x_data),(y_data*y_data))))
Kernel = sess.run(Kernel, feed_dict={x_data: x,y_data: y})

ax = plt.subplot(111, projection='3d')
ax.plot_surface(x, y, Kernel, rstride=1, cstride=1, cmap='rainbow', alpha=0.9)#绘面
ax.set_xlabel('x')
ax.set_ylabel('y')
ax.set_zlabel('Kernel')
plt.show()