import csv
from datetime import datetime
from matplotlib import pyplot as plt
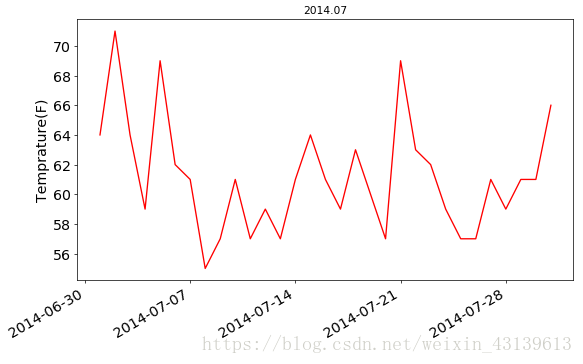
filename = '锡特卡天气07-2014.csv'
with open(filename) as f:
    reader = csv.reader(f)
    #读取文件第一行
    header_row = next(reader)
    print (header_row)
    #打印前两列内容
    dates,highs = [],[]
    for row in reader:
        current_date = datetime.strptime(row[0],'%Y-%m-%d')
        dates.append(current_date)
        high = int(row[1])
        highs.append(high)

    print(dates)
    print(highs)

for index,column_header in enumerate(header_row):
    print(index,column_header)

fig = plt.figure(dpi=64, figsize=(10,6))
plt.plot(dates,highs,c='red')
plt.title('2014.07')
plt.xlabel(' ',fontsize=16)
fig.autofmt_xdate()
plt.ylabel('Temprature(F)',fontsize=16)
plt.tick_params(axis='both',which='major',labelsize=16)

plt.show()
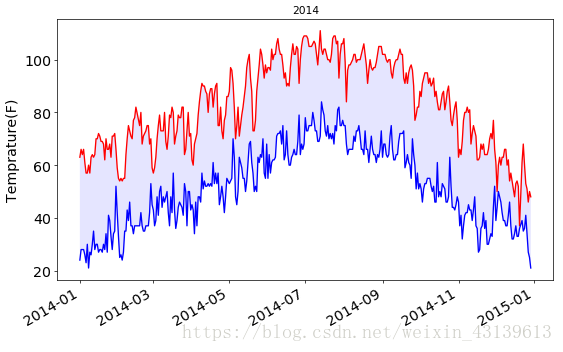
filename = '死谷2014.csv'
with open(filename) as f:
    reader = csv.reader(f)
    #读取文件第一行
    header_row = next(reader)

    #打印前两列内容
    dates,highs,lows = [],[],[]
    for row in reader:
        try:
            current_date = datetime.strptime(row[0],'%Y-%m-%d')
            high = int(row[1])
            low = int(row[3])
        except ValueError:
            print(current_date,'missing data')
        else:
            dates.append(current_date)
            highs.append(high)
            lows.append(low)


for index,column_header in enumerate(header_row):
    print(index,column_header)

fig = plt.figure(dpi=64, figsize=(10,6))
plt.plot(dates,highs,c='red')
plt.plot(dates,lows,c='blue')
plt.title('2014')
plt.xlabel(' ',fontsize=16)
fig.autofmt_xdate()
plt.ylabel('Temprature(F)',fontsize=16)
plt.fill_between(dates,highs,lows,facecolor='blue',alpha=0.1)
plt.tick_params(axis='both',which='major',labelsize=16)

plt.show()
文件中的空白内容的日期打印出来,避免直接报错
2014-02-16 00:00:00 missing data