最近研究了prometheus+grafana的系统监控,使用grafana的报警功能,grafana支持很多种通知渠道,下文记录使用到的几种notification channels,分别是email,kafka和webhook
官网文档 http://docs.grafana.org/alerting/notifications/
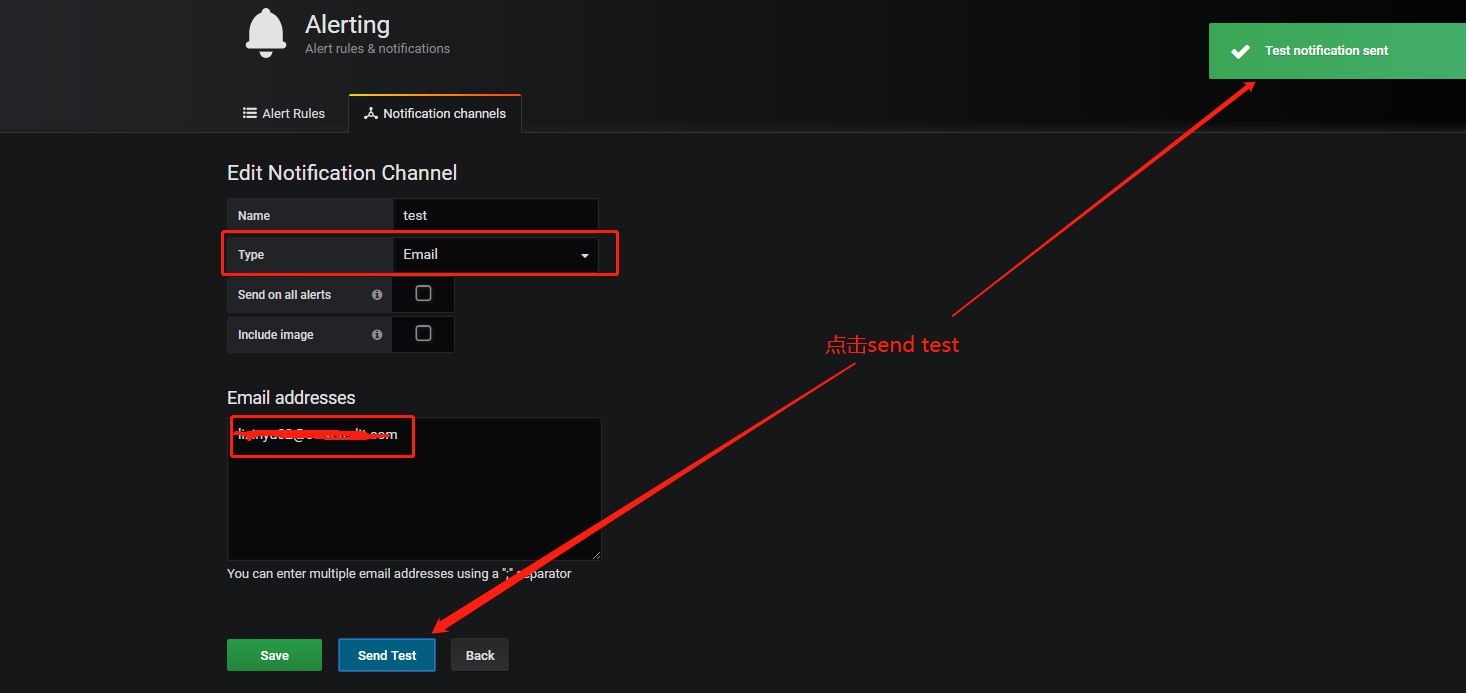
- 发送邮件
修改smtp,找到%GRAFANA_HOME%/conf/defaults.ini(注windows环境)
[smtp]
enabled = true  #开户email发送配置
host = smtp.xxx.com:25  #此处需要加上端口号
user =username@xxx.com  #邮箱账号
# If the password contains # or ; you have to wrap it with triple quotes. Ex """#password;"""
password =1234567890    #邮箱密码
cert_file =
key_file =
skip_verify = true    #跳过校验
from_address = [email protected]
from_name = Grafana
ehlo_identity =
- kafka
向kafka发送消息,需要kafka REST proxy,我使用的中间件是confluent,安装过程没什么特别之外,配置(confluent_home/etc/kafka-rest/kafka-rest.properties)如下
#id=kafka-rest-test-server
#schema.registry.url=http://localhost:8081
#zookeeper.connect=localhost:2181
#bootstrap.servers=PLAINTEXT://localhost:9092
zookeeper.connect=xx.xx.xx.xx:2181
bootstrap.servers=PLAINTEXT://xx.xx.xx.xx:9092
启用kafka-rest服务
bin/kafka-rest-start ../etc/kafka-rest/kafka-rest.properties
添加notification channels
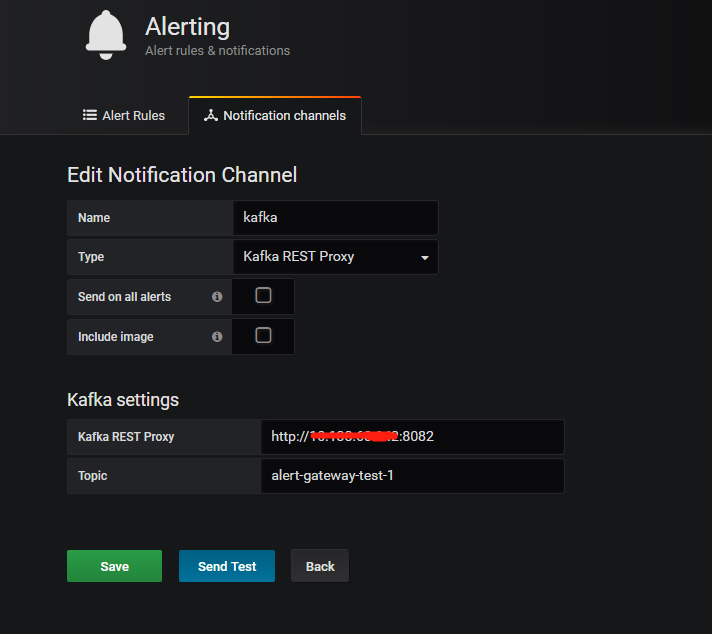
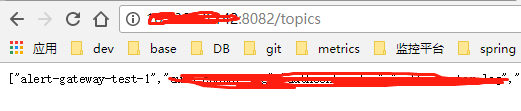
点击 “send test”按钮,浏览kafka-rest服务,alert-gateway-test-1已经在kafka topic里了,开发者可消费kafka的消息,进行后续(自定义)处理
- webhook(推荐)
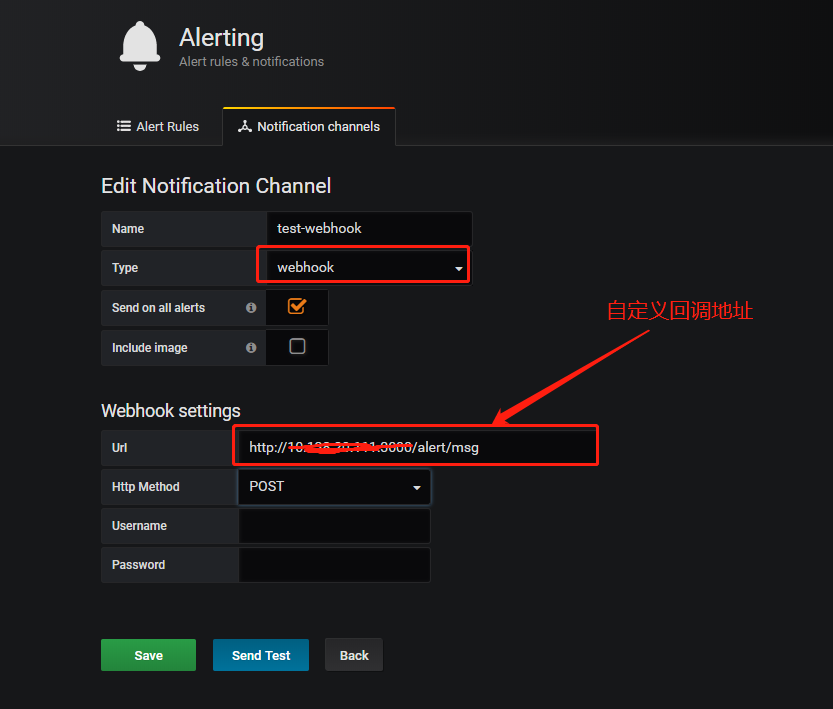
回调参数
{
  "title": "My alert",
  "ruleId": 1,
  "ruleName": "Load peaking!",
  "ruleUrl": "http://url.to.grafana/db/dashboard/my_dashboard?panelId=2",
  "state": "alerting",
  "imageUrl": "http://s3.image.url",
  "message": "Load is peaking. Make sure the traffic is real and spin up more webfronts",
  "evalMatches": [
    {
      "metric": "requests",
      "tags": {},
      "value": 122
    }
  ]
}
更详细说明,可以参考官网http://docs.grafana.org/alerting/notifications/