环境介绍
- 192.168.17.30 logstash
- 192.168.17.31 elasticsearch
- 192.168.17.32 kibana
系统相关优化
vim /etc/security/limits.conf
* soft nofile 65536
* hard nofile 131072
* soft nproc 2048
* hard nproc 4096

vim /etc/sysctl.conf
fs.file-max=655350
vm.max_map_count=655360

sysctl -p
安装
位置:192.168.17.30
软件:jdk,nginx,logstash
本文安装nginx来作为日志的生成工具,进行测试,首先安装jdk(可以使用yum源的openjdk)
安装nginx
rpm -ivh http://nginx.org/packages/centos/7/noarch/RPMS/nginx-release-centos-7-0.el7.ngx.noarch.rpm
yum -y install nginx- 修改nginx日志的输出,将nginx的日志输出修改为json格式,方便elk的收集
[root@logstash tmp]# vim /etc/nginx/nginx.conf

    log_format json '{"@timestamp": "$time_iso8601",'
                '"@version": "1",'
                '"client": "$remote_addr",'
                '"url": "$uri", '
                '"status": "$status", '
                '"domain": "$host", '
                '"host": "$server_addr",'
                '"size":"$body_bytes_sent", '
                '"response_time": "$request_time", '
                '"referer": "$http_referer", '
                '"ua": "$http_user_agent" } ';
    access_log  /var/log/nginx/access.log  json;
- 重启nginx并设置开机自启
systemctl enable nginx
systemctl start nginx
安装logstash
- 去官网下载logstash最新版的tar包,下载地址 https://www.elastic.co/cn/downloads/logstash
[root@logstash ~]# tar -xf logstash-6.4.0.tar.gz -C /opt
- 修改或创建一个配置文件
[root@logstash ~]# cd /opt/logstash-6.4.0/config/
[root@logstash config]# ls
jvm.options  log4j2.properties  logstash-sample.conf  logstash.yml  pipelines.yml  startup.options
[root@logstash config]# cp logstash-sample.conf logstash-nginx.conf
[root@logstash config]# vim logstash-nginx.conf
# Sample Logstash configuration for creating a simple
# Beats -> Logstash -> Elasticsearch pipeline.
#输入,表示需要采集的日志
input {
  #收集nginx日志
  file{
    type => "nginx-access-log"
    #此处也可以用数组的形式 ["/vat/log/nginx/access.log"] 来代替。
    path => "/var/log/nginx/access.log"
    start_position => "beginning"
  }
  #收集系统日志
  file {
    type => "syslog"
    tags => ["sys"]
    path => ["/var/log/messages","var/log/maillog"]
    start_position => "beginning"
  }
}
#直接推送给elasticsearch
output {
  elasticsearch {
    hosts => ["http://192.168.17.31:9200"]
  }
}
#入果有redis 可以推送给redis
#output{
#  redis {
#       host => 192.168.17.33
#       key => 'logstash-redis'
#       date_type => 'list'
#       }
#}

#启动服务
[root@logstash bin]# nohup ./logstash -f ../config/logstash-nginx.conf
安装elasticsearch
位置:192.168.17.31,elasticsearch
- 首先安装java,同上logstash,可安装openjdk
- 下载elasticsearch源码包并解压。下载地址:http://artifacts.elastic.co
[root@elasticsearch ~]# yum -y install java-1.8.0-openjdk.x86_64
[root@elasticsearch ~]# wget https://artifacts.elastic.co/downloads/elasticsearch/elasticsearch-6.4.0.tar.gz
[root@elasticsearch ~]# tar -xf elasticsearch-6.4.0.tar.gz -C /opt- 创建普通用户elk,并给elasticsearch目录赋权,因为elasticsearch不允许root启动
[root@elasticsearch ~]# groupadd elk
[root@elasticsearch ~]# useradd elk -g elk
[root@elasticsearch ~]# chown -R elk:elk /opt/elasticsearch-6.4.0/
- 修改elasticsearch配置文件 接受来自logstash的日志
[root@elasticsearch config]# pwd
/opt/elasticsearch-6.4.0/config
[root@elasticsearch config]# vim elasticsearch.yml
network.host: 192.168.17.31 #声明本节点的ip
http.port: 9200 #http 通信端口- 使用elk用户启动服务
- 启动之后可以使用curl ip:9200来查看是否成功,结果如下
[root@kinana ~]# curl 192.168.17.31:9200
{
  "name" : "CeScCBG",
  "cluster_name" : "elasticsearch",
  "cluster_uuid" : "BCiy5_yJSQyyP3Po87Rdug",
  "version" : {
    "number" : "6.4.0",
    "build_flavor" : "default",
    "build_type" : "tar",
    "build_hash" : "595516e",
    "build_date" : "2018-08-17T23:18:47.308994Z",
    "build_snapshot" : false,
    "lucene_version" : "7.4.0",
    "minimum_wire_compatibility_version" : "5.6.0",
    "minimum_index_compatibility_version" : "5.0.0"
  },
  "tagline" : "You Know, for Search"
}
安装kibana
位置:192.168.17.32 Kibana
- 去官网下载源码包tar,并解压,修改配置文件kibana.yml,启动kibana
[root@kibana ~]# wget https://artifacts.elastic.co/downloads/kibana/kibana-6.4.0-linux-x86_64.tar.gz
[root@kibana ~]# tar xf kibana-6.4.0-linux-x86_64.tar.gz -C /opt/
[root@kibana ~]# cd /opt/kibana-6.4.0-linux-x86_64/config/
[root@kibana config]# vim kibana.yml
server.port: 5601
server.host: "0.0.0.0"
elasticsearch.url: "http://192.168.17.31:9200"


[root@kibana bin]# pwd
/opt/kibana-6.4.0-linux-x86_64/bin
[root@kibana bin]# ./kibana
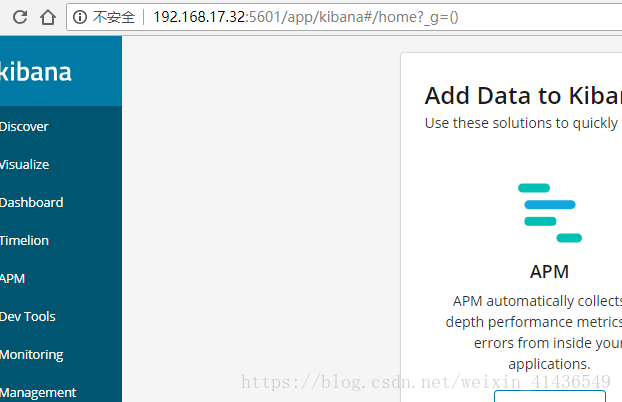
浏览器访问192.168.17.32:5601 即可