deck.gl是由uber开发并开源出来的基于WebGL的大数据量可视化框架。它具有提供不同类型可视化图层,GPU渲染的高性能,React和Mapbox GL集成,结合地理信息数据(GPS)的特点。下面我们就举两个例子探索一下这个神奇的库。
1.第一站:将源码的例子跑起来
源码在github里,首先克隆出来。
npm 下载,在项目根目录下
npm install(友情提醒,如果npm下载速度比较慢,可以使用淘宝镜像,详细请自行搜索)
下面我们来到例子中,和上不一样在example文件夹下下载安装
npm install安装成功之后,要申请mapbox的一个key。方法如下:
在mapbox网站注册后进入https://www.mapbox.com/studio/account/tokens/,我们便可以在Default Public Token
找到我们需要的mapbox key。
在例子文件夹下命令行下输入
export MAPBOX_ACCESS_TOKEN=<上面申请到的key>注意:cmd会不认export,可以使用git命令行,或者直接在代码中加入
//const MAPBOX_TOKEN = process.env.MAPBOX_ACCESS_TOKEN; //改为
const MAPBOX_TOKEN = <上面申请到的key>
然后执行
npm run start浏览器会自动打开,地址为localhost:3030。
第一例子3d-heatmap,我们看到
对应官网上的例子http://uber.github.io/deck.gl/#/examples/core-layers/hexagon-layer
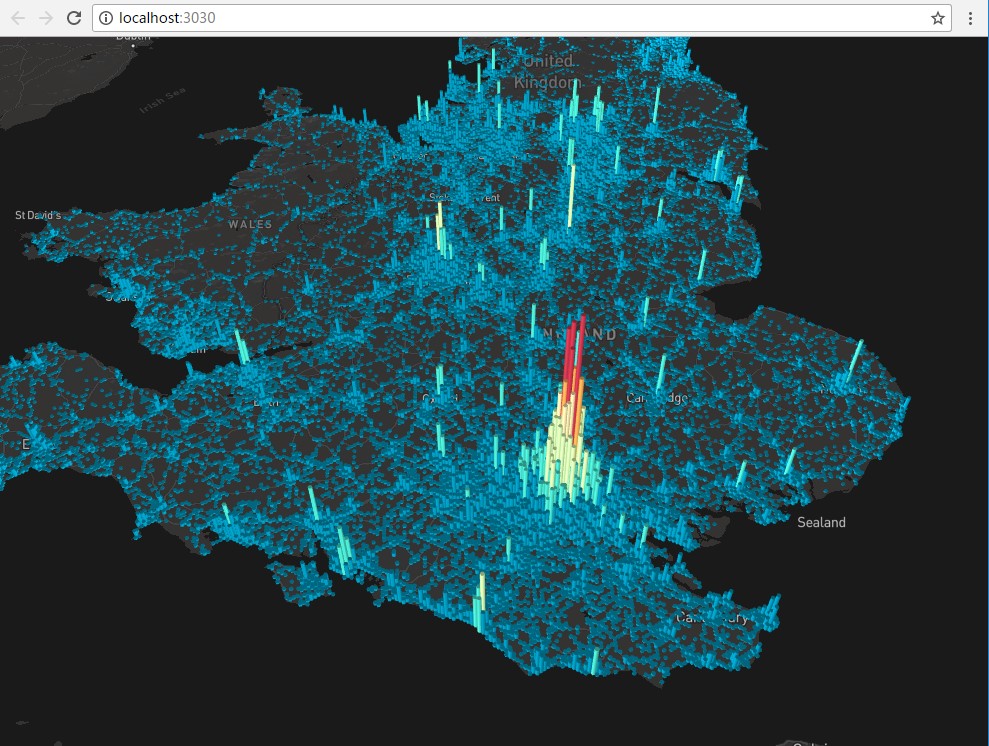
这是一个HexagonLayer的例子。
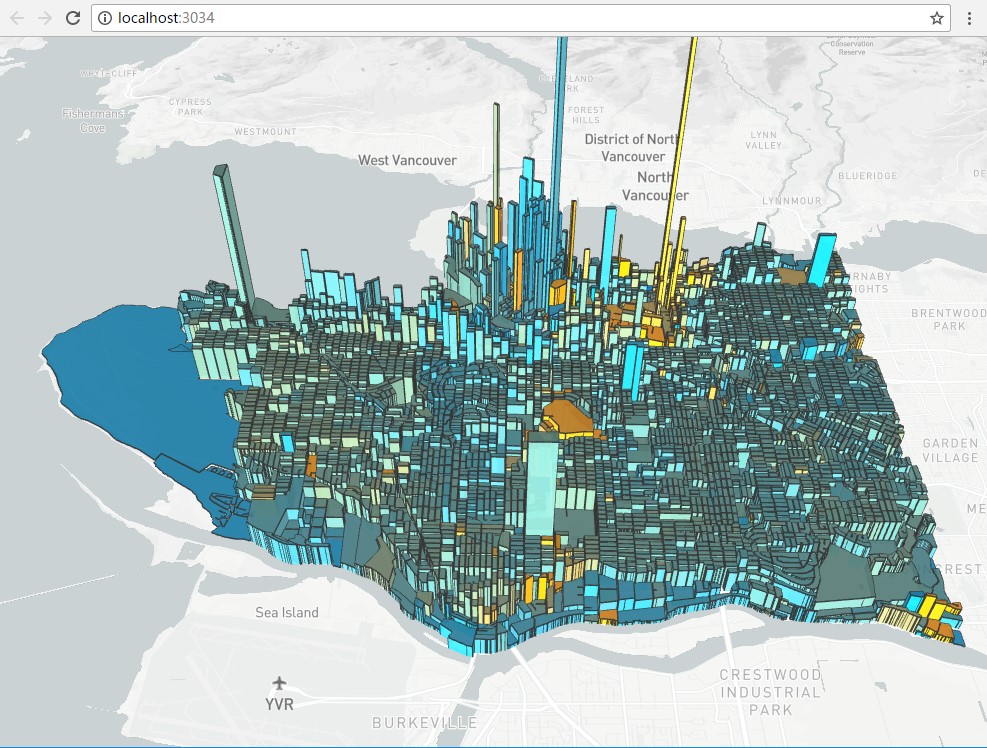
第二个例子是利用geojson
对应官网上的例子http://uber.github.io/deck.gl/#/examples/core-layers/geojson-layer
2.第二站:先拿一个例子看看
第一例子3d-heatmap,显示效果上面有给出。
源码路径。
https://github.com/uber/deck.gl/tree/master/examples/3d-heatmap
deck.gl 是基于地理信息数据的,所以可视化很多都会分层两层,一层是地图数据底图,一层是可视化的数据。这个观念我们要记住,带进去看整个例子。对于这个例子组件MapGL是地里数据底图,组件DeckGLOverlay是可视化成的数据。
基本结构很见简单。
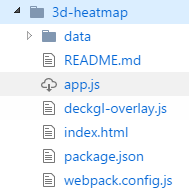
由于是使用React框架搭建,html很简单
- index.html
<!doctype html>
<html>
  <head>
    <meta charset='UTF-8' />
    <title>deck.gl example</title>
    <style>
      body {margin: 0; padding: 0; overflow: hidden;}
    </style>
  </head>
  <body>
    <script src='bundle.js'></script>
  </body>
</html>- deckgl-overlay.js
首先引入React和deckgl。
import React, {Component} from 'react';
import DeckGL, {HexagonLayer} from 'deck.gl';
几个变量先放出来,光线设置(LIGHT_SETTINGS),颜色范围设置(colorRange),高度显示范围(elevationScale),一些默认的属性(defaultProps)。
const LIGHT_SETTINGS = {
  lightsPosition: [-0.144528, 49.739968, 8000, -3.807751, 54.104682, 8000],
  ambientRatio: 0.4,
  diffuseRatio: 0.6,
  specularRatio: 0.2,
  lightsStrength: [0.8, 0.0, 0.8, 0.0],
  numberOfLights: 2
};

const colorRange = [
  [1, 152, 189],
  [73, 227, 206],
  [216, 254, 181],
  [254, 237, 177],
  [254, 173, 84],
  [209, 55, 78]
];

const elevationScale = {min: 1, max: 50};

const defaultProps = {
  radius: 1000,
  upperPercentile: 100,
  coverage: 1
};我们建立叫DeckGLOverlay的组件
export default class DeckGLOverlay extends Component {
}组件中提供了两个静态的属性,静态属性可以使用[类名].[方法名]调用,例如:DeckGLOverlay.defaultColorRange。
  static get defaultColorRange() {//默认的颜色范围
    return colorRange;
  }

  static get defaultViewport() {//默认的视图
    return {
      longitude: -1.4157267858730052,
      latitude: 52.232395363869415,
      zoom: 6.6,
      minZoom: 5,
      maxZoom: 15,
      pitch: 40.5,
      bearing: -27.396674584323023
    };
}constructor是构造函数,主要看的是_animateHeight对组件state的设置,这个是用来控制高度的
  constructor(props) {
    super(props);
    this.startAnimationTimer = null;
    this.intervalTimer = null;
    this.state = {
      elevationScale: elevationScale.min
    };

    this._startAnimate = this._startAnimate.bind(this);
    this._animateHeight = this._animateHeight.bind(this);

  }

  componentDidMount() {
    this._animate();
  }

  componentWillReceiveProps(nextProps) {
    if (nextProps.data.length !== this.props.data.length) {
      this._animate();
    }
  }

  componentWillUnmount() {
    this._stopAnimate();
  }

  _animate() {
    this._stopAnimate();

    // wait 1.5 secs to start animation so that all data are loaded
    this.startAnimationTimer = window.setTimeout(this._startAnimate, 1500);
  }

  _startAnimate() {
    this.intervalTimer = window.setInterval(this._animateHeight, 20);
  }

  _stopAnimate() {
    window.clearTimeout(this.startAnimationTimer);
    window.clearTimeout(this.intervalTimer);
  }

  _animateHeight() {
    if (this.state.elevationScale === elevationScale.max) {
      this._stopAnimate();
    } else {
      this.setState({elevationScale: this.state.elevationScale + 1});
    }
  }

  _initialize(gl) {
    gl.enable(gl.DEPTH_TEST);
    gl.depthFunc(gl.LEQUAL);
}render渲染方法,layers是可视化渲染的图层定义变量。
  render() {
    const {viewport, data, radius, coverage, upperPercentile} = this.props;

    if (!data) {
      return null;
    }

    const layers = [
      new HexagonLayer({
        id: 'heatmap',
        colorRange,
        coverage,
        data,
        elevationRange: [0, 3000],
        elevationScale: this.state.elevationScale, //高度
        extruded: true,
        getPosition: d => d,          //位置
        lightSettings: LIGHT_SETTINGS,
        onHover: this.props.onHover,
        opacity: 1,
        pickable: Boolean(this.props.onHover),
        radius,
        upperPercentile
      })
    ];

    return <DeckGL {...viewport} layers={layers} onWebGLInitialized={this._initialize} />;
}- app.js
引入:
import React, {Component} from 'react';
import {render} from 'react-dom';
import MapGL from 'react-map-gl';
import DeckGLOverlay from './deckgl-overlay.js';

import {csv as requestCsv} from 'd3-request';//加载csv文件
mapbox key:
const MAPBOX_TOKEN = process.env.MAPBOX_ACCESS_TOKEN; 组件Root:
在构造函数中,我们将两个关键的变量viewport和data均放入到state中。这里的MapGL组件就是地理底图。
class Root extends Component {

  constructor(props) {
    super(props);
    this.state = {
      viewport: {
        ...DeckGLOverlay.defaultViewport,
        width: 500,
        height: 500
      },
      data: null
    };
    //请求csv数据
    requestCsv('./data/heatmap-data.csv', (error, response) => {
      if (!error) {
        const data = response.map(d => ([Number(d.lng), Number(d.lat)]));
        this.setState({data});
      }
    });
  }

  componentDidMount() {
    window.addEventListener('resize', this._resize.bind(this));
    this._resize();
  }

  _resize() {
    this._onChangeViewport({
      width: window.innerWidth,
      height: window.innerHeight
    });
  }

  _onChangeViewport(viewport) {
    this.setState({
      viewport: {...this.state.viewport, ...viewport}
    });
  }

  render() {
    const {viewport, data} = this.state;

    return (
      <MapGL
        {...viewport}
        mapStyle="mapbox://styles/mapbox/dark-v9"
        perspectiveEnabled={true}
        onChangeViewport={this._onChangeViewport.bind(this)}
        mapboxApiAccessToken={MAPBOX_TOKEN}>
        <DeckGLOverlay
          viewport={viewport}
          data={data || []}
        />
      </MapGL>
    );
  }
}
渲染:
render(<Root />, document.body.appendChild(document.createElement('div')));MapGL组件我们来修改下mapStyle来重新生成一张图。
mapStyle="mapbox://styles/mapbox/satellite-v9"来看下显示效果,地图就变成了卫星影像。
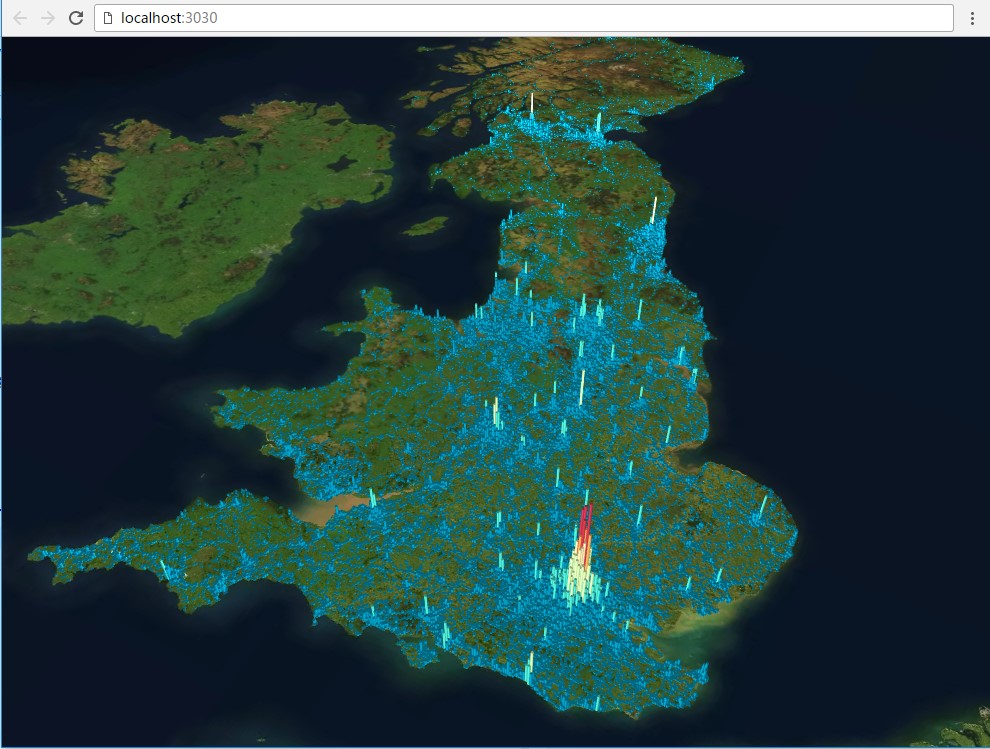
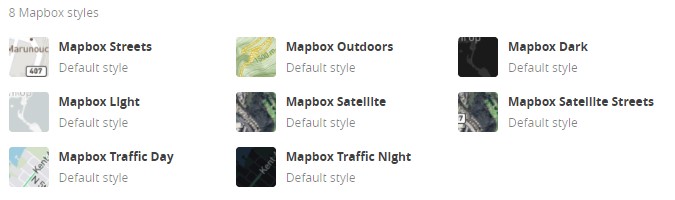
mapbox提供了几款基础的样式,我们还可以自定义样式使用。
3.第三站:总结一下
通过上面我们就分析了一个简单的例子,使用Deck.gl,MapGL组件,利用两百多行代码就可以渲染14万多条数据,而且显示效果让我们惊叹,还支持交互,性能比较好,基于WebGL的大数据二三维可视化一个值得研究的方向。
参考阅读:
- uber deck.gl官网
- uber可能用到的可视化技术
- Uber工程的deck.gl框架下的Web数据可视化集