为了更好的支持前端能够自由组合、展示收到的数据,笔者使用graphql-go 框架开发了负责的模块,但测试过程中发现,使用GraphQL会有n+1 query的问题。经过调研发现两种解决方案:
- 使用graphql-gophers下的graphql-go,已经支持如下特性:
- minimal API
- support for
context.Context - support for the
OpenTracingstandard - schema type-checking against resolvers
- resolvers are matched to the schema based on method sets (can resolve a GraphQL schema with a Go interface or Go struct).
- handles panics in resolvers
- parallel execution of resolvers
- 在使用graphql-go的同时使用facebook开源的dataloader工具,详细例子见dataloader的issues: Example to use with graphql-go
n + 1 query解释
Scheme (simplified):
““
type Query {
orders: [Order]
}
type Order {
id: ID
client: Client
}
type Client {
id: ID
name: String
}
““
Query:
query GetOrders {
  orders {
    client {
      name
    }
  }
}解释:
为了返回100个orders,必须发送101个请求给微服务(1个请求获取批量的orders,100个获取它的client信息(每个order都需要执行一次client信息查询)。详细信息见issues: No way to get requested fields inside resolver
性能分析过程
使用vegeta工具向服务发送流量,然后使用pprof和go-torch工具对服务进行分析。
vegeta命令说明
向服务发送流量命令
echo "POST http://localhost:8080/graphql" | vegeta attack -body /vegeta/rqst.txt -duration=30s -rate=200 > r.bin发送流量结果分析
 vegeta vegeta report -inputs=r.bin
Requests      [total, rate]            6000, 200.03
Duration      [total, attack, wait]    29.998652838s, 29.994999868s, 3.65297ms
Latencies     [mean, 50, 95, 99, max]  3.740812ms, 3.649598ms, 4.53176ms, 5.088892ms, 22.366809ms
Bytes In      [total, mean]            222000, 37.00
Bytes Out     [total, mean]            2802000, 467.00
Success       [ratio]                  100.00%
Status Codes  [code:count]             200:6000
Error Set:- 向服务发送流量命令解释: 向部署在本地的端口号为8080的服务发送POST请求,持续时间为30s,每秒发送200个请求,请求的内容存放在vegeta目录下的rqst.txt文件中。
- 发送流量结果分析解释: 对压测的结果以报表的形式展示出来。
pprof命令说明
在使用vegeta命令压测的同时使用go tool的pprof工具分析CPU的耗时go tool pprof -seconds 25 http://localhost:8080/debug/pprof/profile,持续25s后输入web ,生成如下所示的内容:
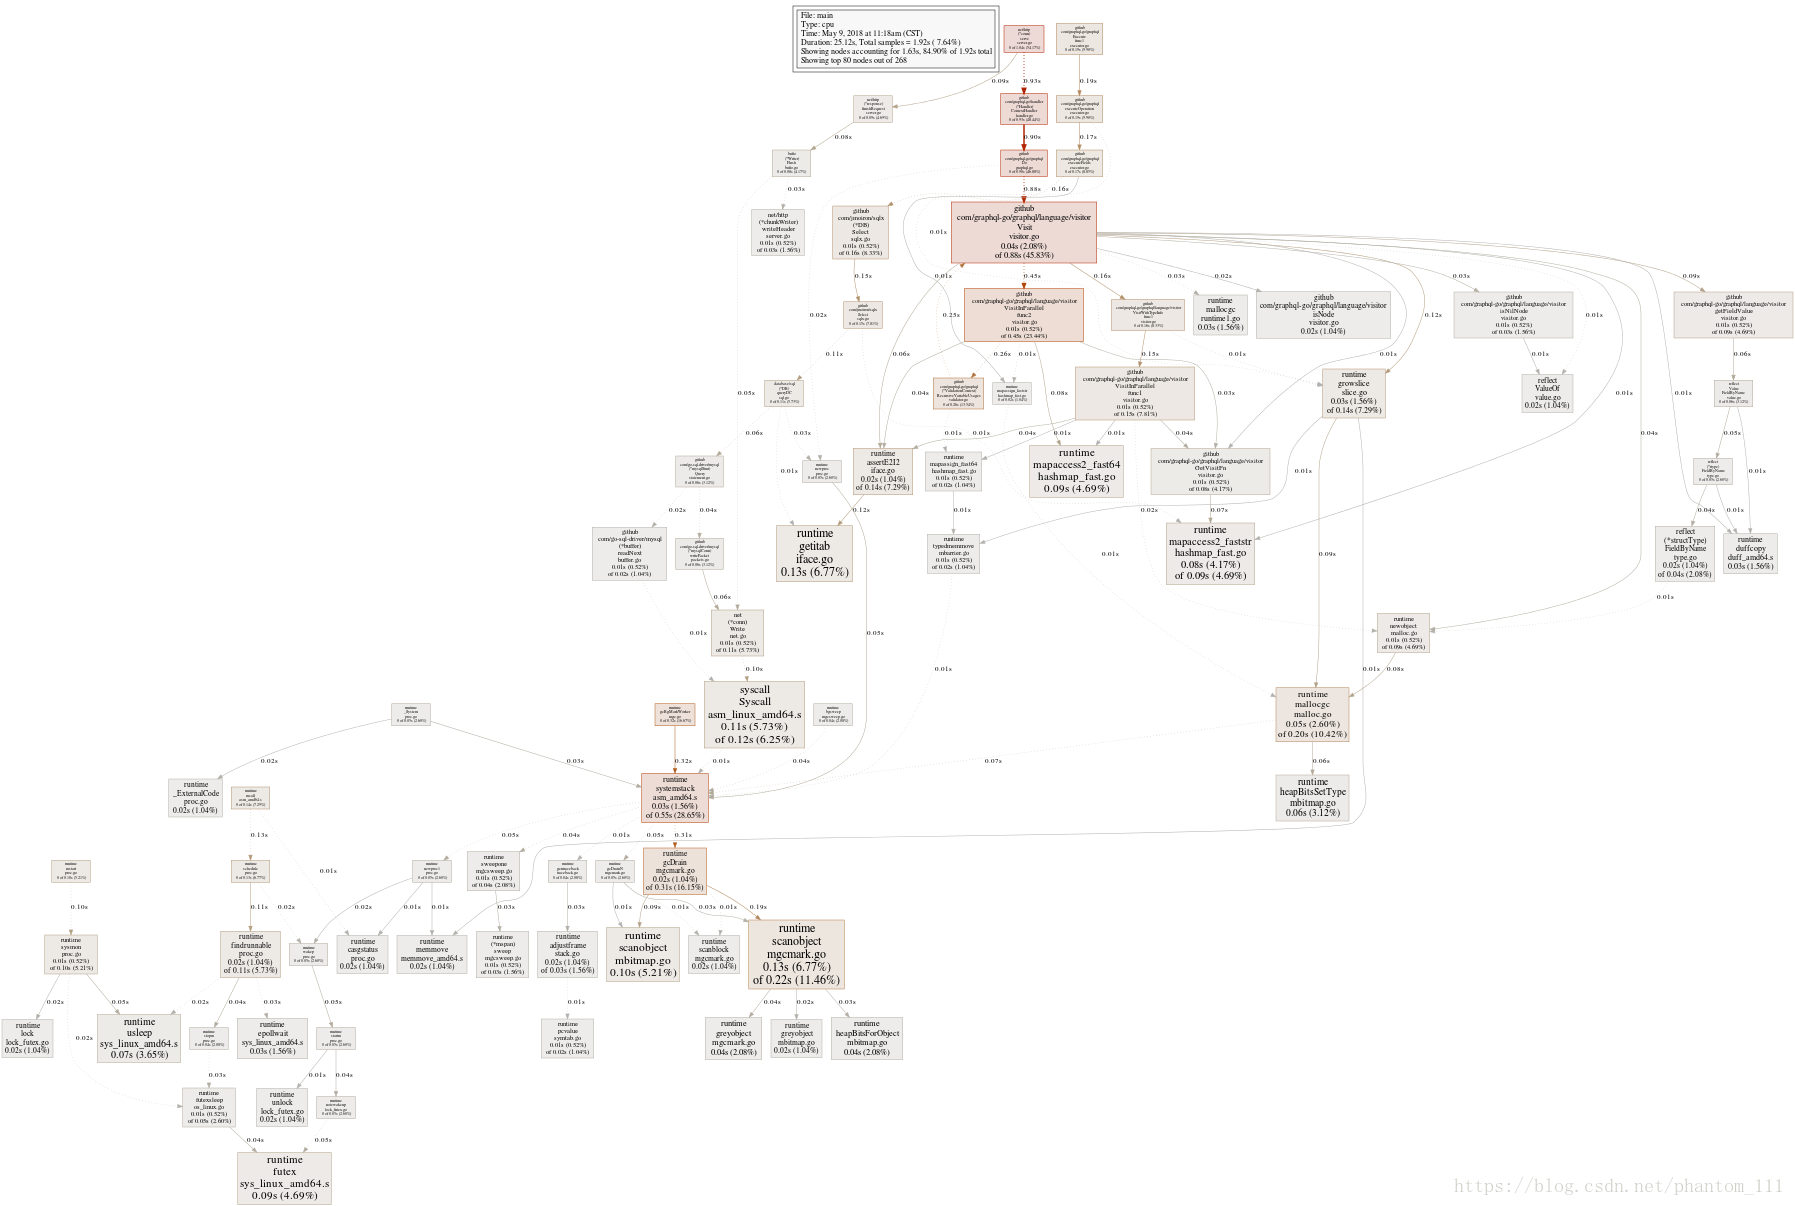
虽然go1.9在使用pprof工具生成CPU耗时分析的时候较之前的版本已经加入了颜色,但是看起来仍不是很直观,这个时候就需要使用火焰图了。
go-torch生成火焰图
在使用vegeta命令压测的同时使用go-torch工具生成火焰图,命令go-torch -u http://192.168.189.168 -t 25 生成的火焰图如下图所示:(192.168.189.168为本地的localhost)
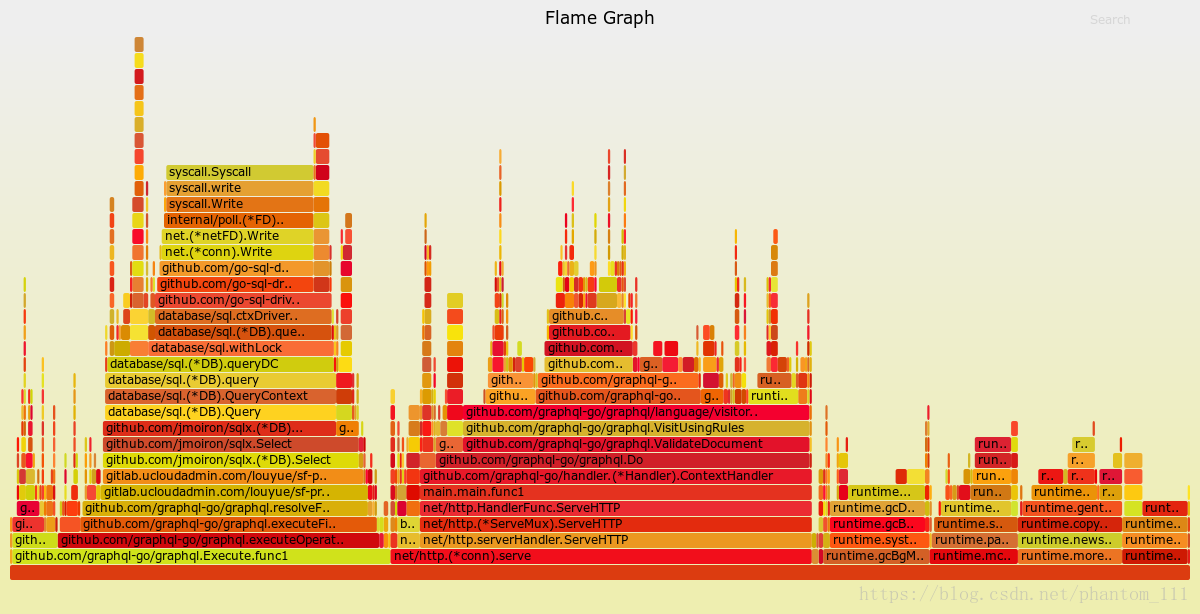
通过火焰图分析,graphql-go框架的占用很多的CPU耗时,查找资料发现,主要原因是graphql的Resolver函数的解析并非并发解析,所以会产生上面描述的n + 1 query的问题。