最近公司项目里需要做一个组织架构图,做就做吧,还要在显示头像图片。想了很多办法,最开始是想用eCharts的,但是对eCharts不熟悉,很多配置不会改;然后想着用css+html纯手写一个吧,可是数据是动态生成的,不会做。然后百度找到一个叫TWaver的东西,不知道是软件还是插件还是其他的什么东西,网上搜不到源码,是要付费的。就算付费买了,也不知道好不好用,所以果断放弃。然后上GitHub上搜了一个插件,叫jOrgChart(源码下载地址:https://github.com/wesnolte/jOrgChart)。然后试了下demo,好吧,看不到效果,因为需要FQ。
于是又百度,找到了一篇文章(原文:https://www.cnblogs.com/liboxncg/p/6249752.html),参考了这篇文章。
然后开始步骤吧。
第一步:引入需要的文件
①jquery.jOrgChart.css
②jquery.min.js
③jquery.jOrgChart.js
<link rel="stylesheet" href='jquery.jOrgChart.css'/>
<script type='text/javascript' src='jquery-1.11.0.js'></script>
<script type='text/javascript' src='jquery.jOrgChart.js'></script>
这三个文件都可以从下载的源码里面拿出来。
第二步:
json文件

test.json:
{
"data": [{
"id": 1,
"name": "企业主体信用得分",
"pid": null,
"picurl":"head-pic.png",
"childrens": [
{
"id": 2,
"name": "企业素质",
"pid": 1,
"picurl":"head-pic.png",
"childrens": [
{
"id": 5,
"name": "基本信息",
"pid": 2,
"picurl":"head-pic.png",
"childrens": [
{
"id": 10,
"name": "企业主体信息识别",
"pid": 5,
"picurl":"head-pic.png",
"childrens": [
]
},
{
"id": 11,
"name": "企业持续注册时间",
"pid": 5,
"picurl":"head-pic.png",
"childrens": [
]
},
{
"id": 12,
"name": "注册资本",
"pid": 5,
"picurl":"head-pic.png",
"childrens": [
]
}
]
},
{
"id": 6,
"name": "管理认证",
"pid": 2,
"picurl":"head-pic.png",
"childrens": [
{
"id": 13,
"name": "国际性管理认证",
"pid": 6,
"picurl":"head-pic.png",
"childrens": [
]
},
{
"id": 13,
"name": "国际性管理认证222",
"pid": 6,
"picurl":"head-pic.png",
"childrens": [
]
}
]
}
]
},
{
"id": 3,
"name": "履约记录",
"pid": 1,
"picurl":"head-pic.png",
"childrens": [
{
"id": 7,
"name": "税务执行情况",
"pid": 3,
"picurl":"head-pic.png",
"childrens": [
{
"id": 14,
"name": "是否按时缴纳税款",
"pid": 7,
"picurl":"head-pic.png",
"childrens": [
]
},
{
"id": 15,
"name": "是否按时缴纳税款1",
"pid": 8,
"picurl":"head-pic.png",
"childrens": [
]
}
]
},
{
"id": 8,
"name": "网贷情况",
"pid": 3,
"picurl":"head-pic.png",
"childrens": [
{
"id": 15,
"name": "网贷逾期",
"pid": 8,
"picurl":"head-pic.png",
"childrens": [
]
}
]
}
]
}
]
}
]
}
css样式部分
<style>
a {
text-decoration: none;
color: #000;
font-size: 12px;
}
.jOrgChart .node {
width: 100px;
height: 150px;
line-height: 50px;
border-radius: 4px;
margin: 0 8px;
background-color: #fff;
position: relative;
}
.jOrgChart .node a{
display: block;
position: absolute;
top:100px;
}
.jOrgChart .node .pic{
position: absolute;
width: 100px;
height: 100px;
top: 0;
border-radius:50% ;
background: #006633;
}
</style>
html代码部分:
<body>
<!--显示组织架构图-->
<div id='jOrgChart'></div>
<script type='text/javascript'>
$(function(){
//数据返回
$.ajax({
url: "test.json",
type: 'GET',
dataType: 'JSON',
data: {action: 'org_select'},
success: function(result){
var showlist = $("<ul id='org' style='display:none'></ul>");
showall(result.data, showlist);
$("#jOrgChart").append(showlist);
$("#org").jOrgChart( {
chartElement : '#jOrgChart',//指定在某个dom生成jorgchart
dragAndDrop : false//设置是否可拖动
});
}
});
});
function showall(menu_list, parent) {
$.each(menu_list, function(index, val) {
if(val.childrens.length > 0){
var li = $("<li></li>");
li.append("<a href='javascript:void(0)'>"+val.name+"</a>").append("<ul></ul>").appendTo(parent);
li.append("<a class='pic' href='javascript:void(0)'><img src='"+val.picurl+"'/></a>").append("<ul></ul>").appendTo(parent);
//递归显示
showall(val.childrens, $(li).children().eq(1));
}else{
var lil=$("<li></li>");
lil.append("<a href='javascript:void(0)'>"+val.name+"</a>").appendTo(parent);
lil.append("<a class='pic' href='javascript:void(0)'><img src='"+val.picurl+"'/></a>");
}
});
}
</script>
</body>
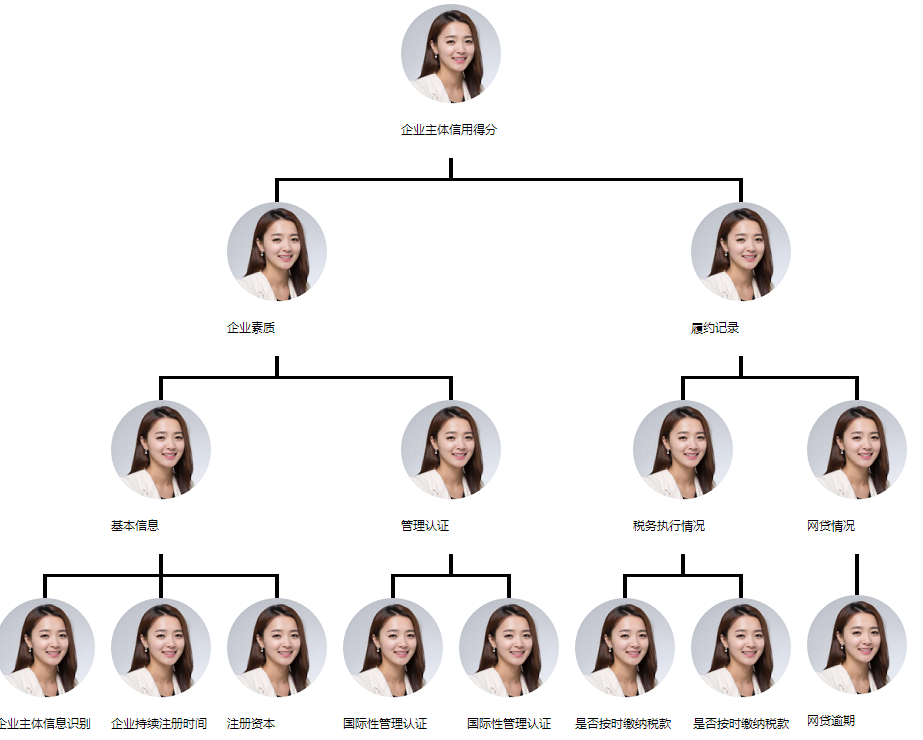
参考的原文是没有显示图片这个功能的,但是工作要求是要显示头像,琢磨了半天,终于想到,在js配置文件里面配置就可以了,这点遵循了插件使用的原则,修修改改。刚开始,直接在showall这个函数里面直接像demo一样append元素,结果失败。后面使用了定位的方法,子绝父相,给他把位置定好了就好啦。这个插件是真的好用,js代码就两百来行,感兴趣的可以深入研究。
下面是效果图: