Centos6.4 安装elk (elasticsearch logstash kibana)
elasticsearch
安装elasticsearch 以及插件head
采用二进制文件安装elasticsearch6.3.2
下载elasticsearch-6.3.2.tar.gz到/usr/local
| cd /usr/local tar -zxvf elasticsearch-6.3.2.tar.gz wget https://artifacts.elastic.co/downloads/elasticsearch/elasticsearch-6.2.2.tar.gz rm -rf /usr/local/elasticsearch-6.3.2.tar.gz #创建日志文件夹 mkdir -p /usr/local/elasticsearch-6.3.2/log
#修改elasticsearch.yml配置文件 ---------------------------------------------------------------------- cat > /usr/local/elasticsearch-6.3.2/config/elasticsearch.yml <<EOF #cluster.name 集群的cluster.name 必须一致 cluster.name: elasticsearch
#node.name 集群的node.name 不一致 node.name: node-8
#path to data path.data: /usr/local/elasticsearch-6.3.2/data
#path to log path.logs: /usr/local/elasticsearch-6.3.2/log
#设置内存不会到交换分区上 需要安装插件 在5.0之后没有该配置了 #bootstrap.mlockall: true
node.master: true
#监听的主机 network.host: 0.0.0.0 #集群设置 discovery.zen.ping.unicast.hosts: ["10.29.112.172", "10.29.113.121"]
#监听的端口 http.port: 9200 transport.tcp.port: 9300
bootstrap.memory_lock: false bootstrap.system_call_filter: false
#便于监控插件走http协议获取相关数据 http.cors.enabled: true http.cors.allow-origin: "*"
#回收缓存 避免es服务器内存一直增大 #缓存数据+当前查询需要缓存的数据量到达断路器限制时,会返回Data too large错误 indices.fielddata.cache.size: 60% EOF discovery.zen.ping.unicast.hosts: ["10.6.11.176", "10.6.11.177"] 建议使用ip 避免dns 解析出问题导致es 故障 |
另一台es 也同样安装
node.master: true
如果2个设置node.master: true 则先启动的es为主
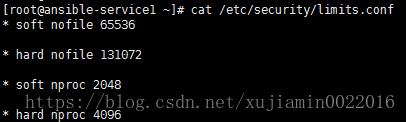
| 修改/etc/security/limits.conf 参数 yum 安装的es默认是普通用户 需要修改limit yum 安装权限是默认设置好的 会创建用户 用户组
修改/etc/sysctl.conf cat > /etc/sysctl.conf <<EOF vm.max_map_count=655360 EOF sysctl -p
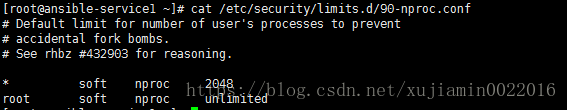
修改/etc/security/limits.d/90-nproc.conf cat > /etc/security/limits.d/90-nproc.conf <<EOF * soft nproc 2048 root soft nproc unlimited EOF 如果需要 也可以改大 elastic用户 正常情况够用
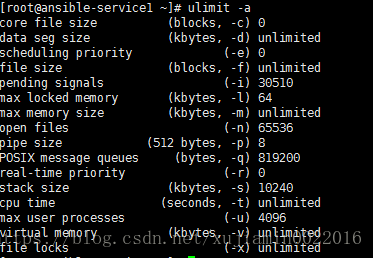
ulimit -a 查看opne file 值 如果过小 需要改大 建议65536 |

创建elastic用户 并切换到该用户启动
| useradd elastic chown -R elastic:elastic elasticsearch-6.3.2 su - elastic -c "sh /usr/local/elasticsearch-6.3.2/bin/elasticsearch -d" |
安装header
安装header 需要用到grunt 所以先安装node
#解压安装
cd /tmp
mkdir -p /usr/local/node
tar xvf node-v8.10.0-linux-x64.tar
mv node-v8.10.0-linux-x64 /usr/local/node/
#在环境变量中加入node地址
cat >>/etc/profile.d/node.sh<<EOF
export NODE_PATH=/usr/local/node/node-v8.10.0-linux-x64
export PATH=$NODE_PATH/bin:$PATH
EOF
#应用/etc/profile 并添加软链接
cd /etc/profile.d/
. /etc/profile
. /etc/bashrc
ln -s /usr/local/node/node-v8.10.0-linux-x64/bin/node /usr/bin
ln -s /usr/local/node/node-v8.10.0-linux-x64/bin/npm /usr/bin
ln -s /usr/local/node/node-v8.10.0-linux-x64/bin/grunt /usr/bin
#查看node版本
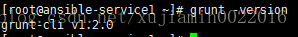
node -v
#安装grunt
npm -g config set user root
npm install -g grunt-cli
#安装header
cd /usr/local/elasticsearch-6.3.2/
wget https://github.com/mobz/elasticsearch-head/archive/master.zip
unzip master.zip
cd elasticsearch-head-master/
npm install

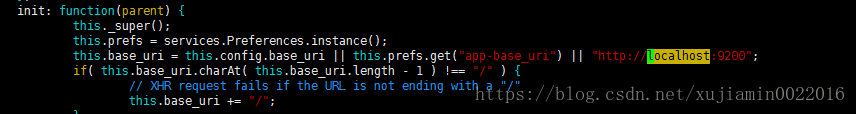
修改_site/app.js中localhost为安装header的服务器的ip

在elasticsearch-head-master的文件夹中执行
grunt server >/dev/null &
查看header是否启动 存在9100端口即启动成功
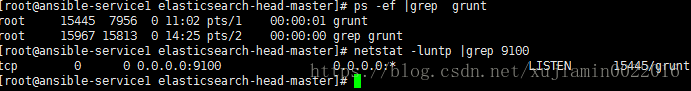
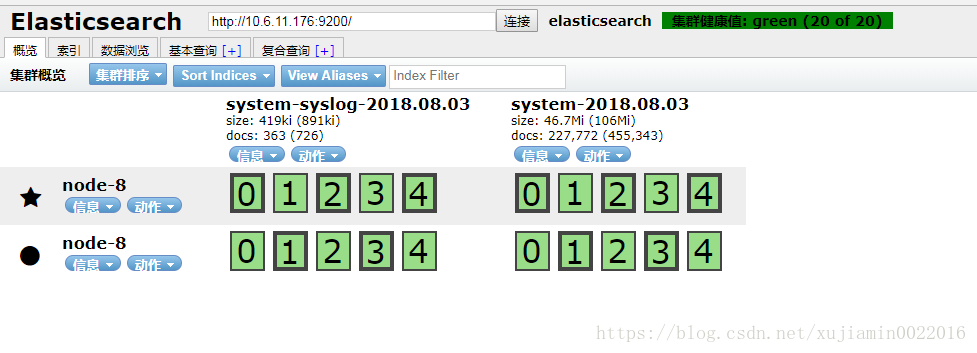
访问10.6.11.176:9100 显示如下界面

★星号表示主节点
如果连接header 提示不能连接 请检查防火墙 是否开启9200端口
或者检查配置文件是否含有下列配置
#便于监控插件走http协议获取相关数据
http.cors.enabled: true
http.cors.allow-origin: "*"
logstash
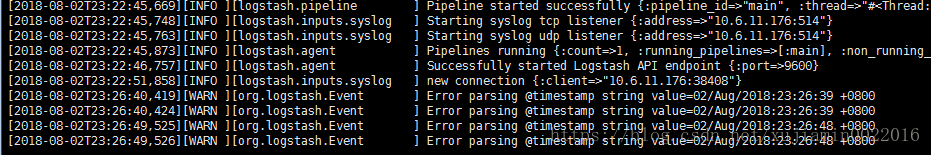
logstash 间隔15s
避免使用localhost,localhost换成ip
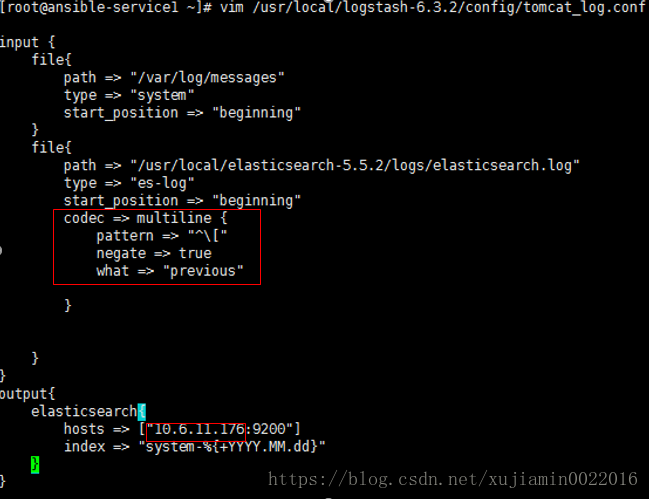
为了让错误日志输出再同一行 需改conf文件
system
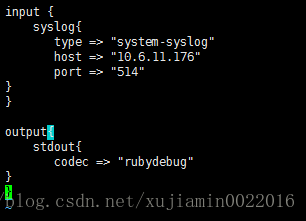
添加syslog到logstash中
现在/etc/rsyslog.conf中开放权限

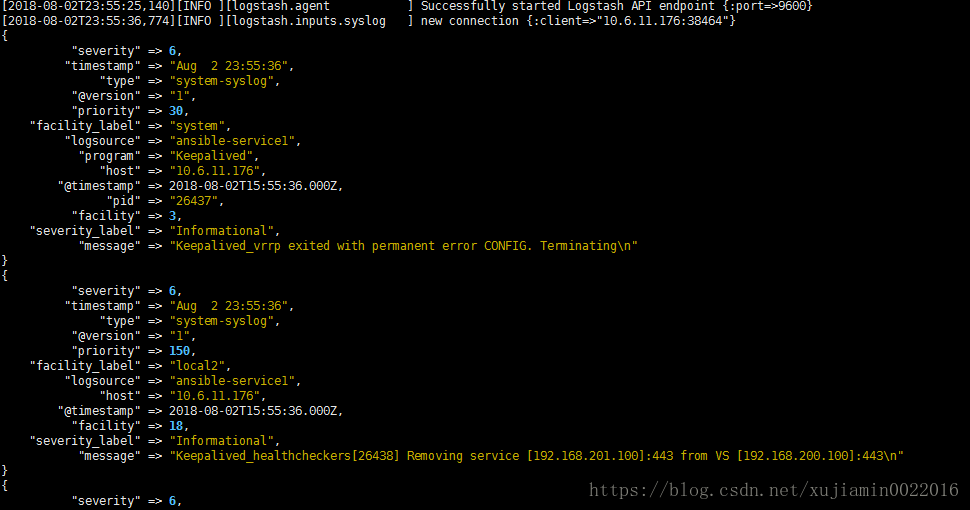
先用debug模式测试
测试成功后在logstash的all.conf文件中添加if 避免输出难以分辨 添加if判断
nginx
添加nginx访问日志到logstash
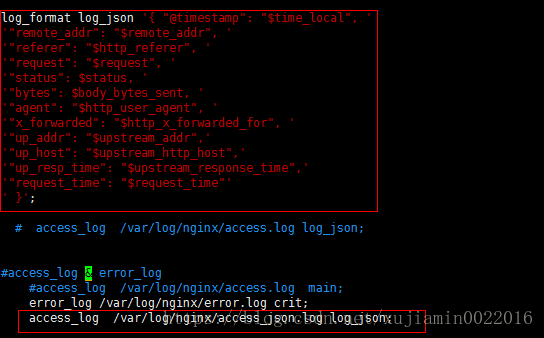
将nginx的access.log输出成json格式 需要修改nginx.conf
| log_format log_json '{ "@timestamp": "$time_local", ' '"remote_addr": "$remote_addr", ' '"referer": "$http_referer", ' '"request": "$request", ' '"status": $status, ' '"bytes": $body_bytes_sent, ' '"agent": "$http_user_agent", ' '"x_forwarded": "$http_x_forwarded_for", ' '"up_addr": "$upstream_addr",' '"up_host": "$upstream_http_host",' '"up_resp_time": "$upstream_response_time",' '"request_time": "$request_time"' ' }';
|
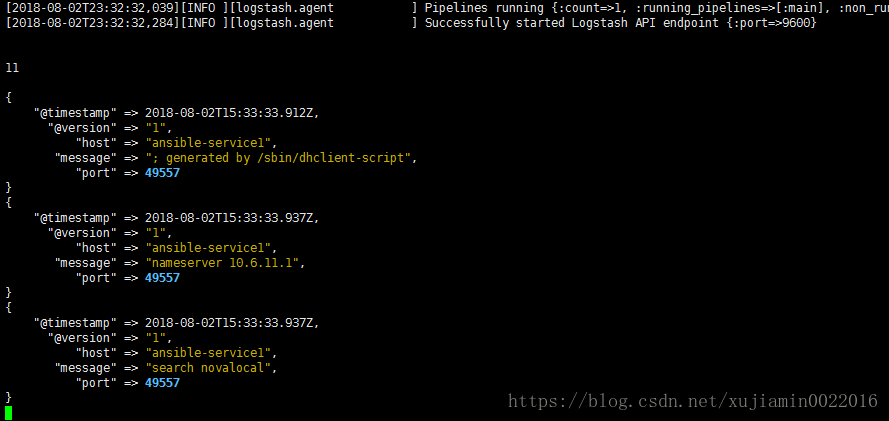
使用debug先测试


tcp 日志

rubydebug 调试

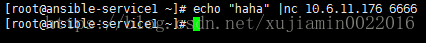
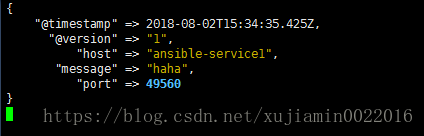
也可以使用
echo “test” > /dev/tcp/10.6.11.176/6666
mysql
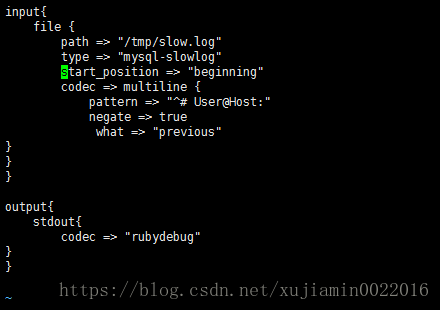
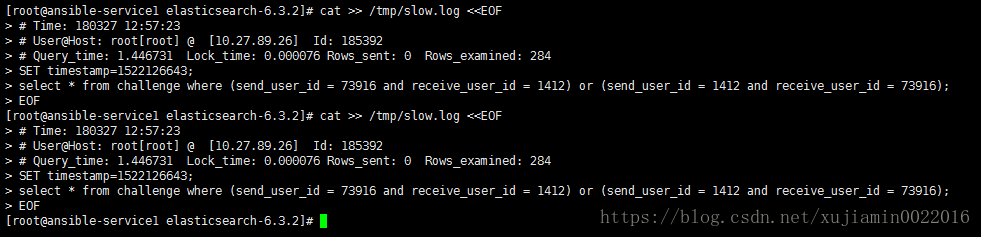
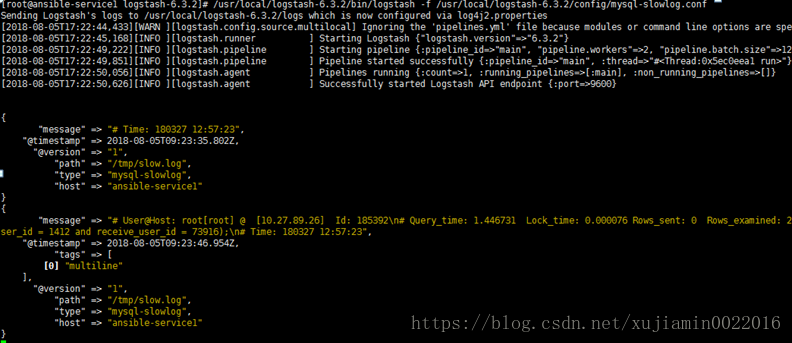
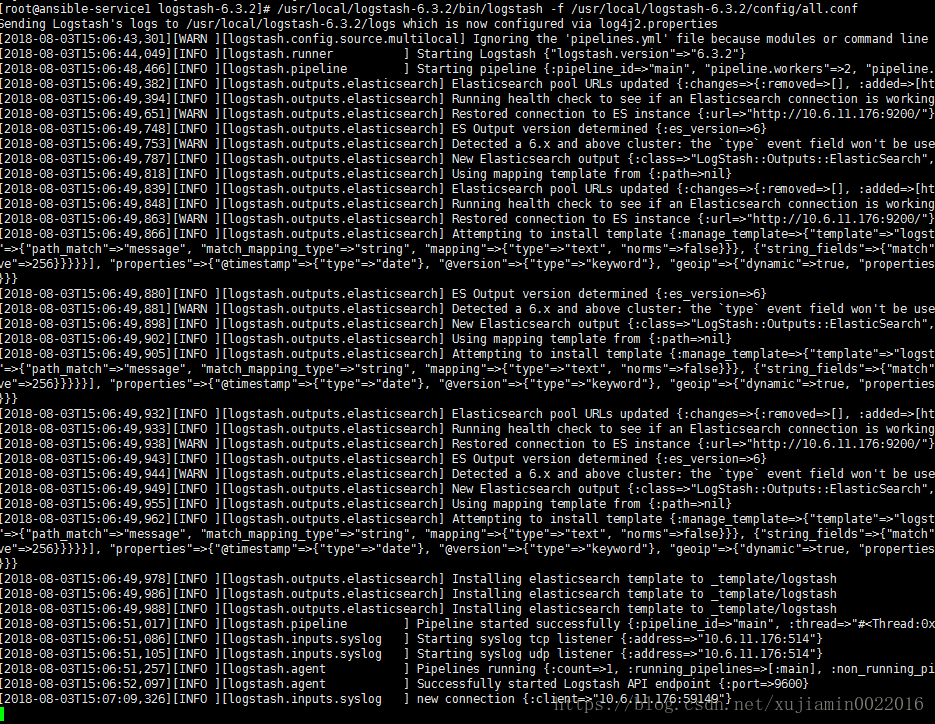
启动logstash
/usr/local/logstash-6.3.2/bin/logstash -f /usr/local/logstash-6.3.2/config/all.conf
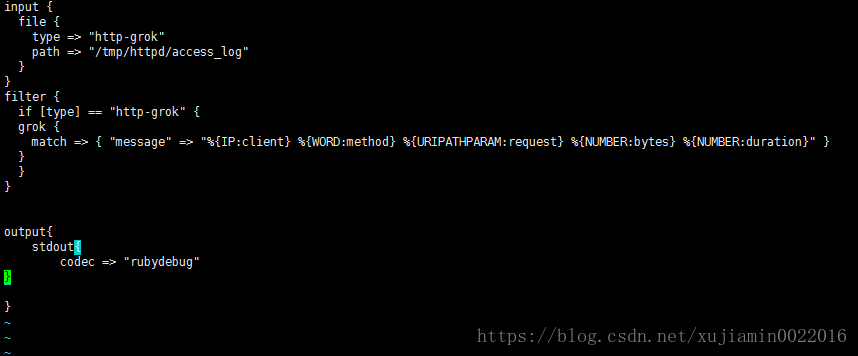
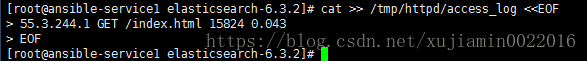
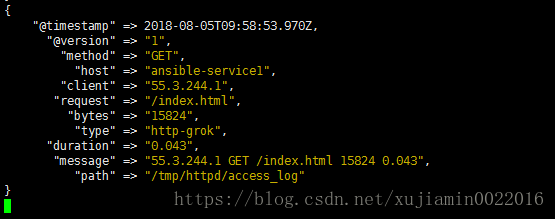
grok
这边我没有找到http.log 于是临时搞了个http的日志 参照官网的格式 输入到access_log中
使用redis 解耦logstash消息队列
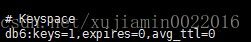
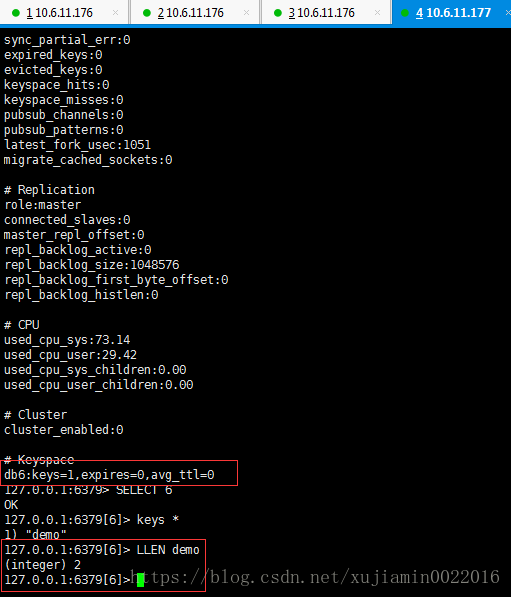
链接redis 输入info
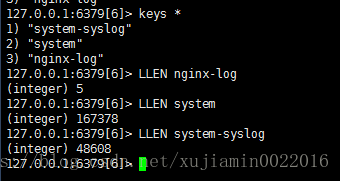
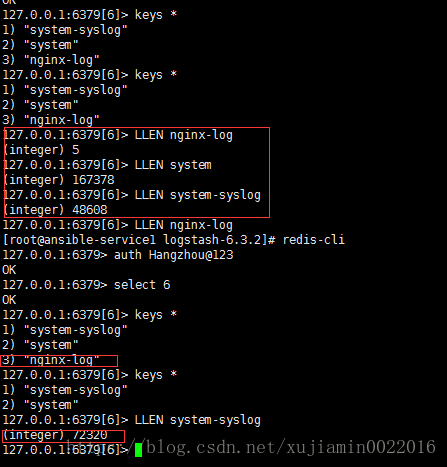
发现创建了db6 里面有一个key
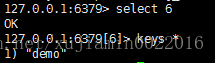
select 6
keys *
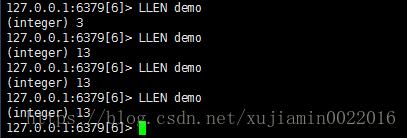
LINDEX demo -1 #常看列表的最后一行

读redis往es写 test-redis.conf

先查看里面多少条数据
在redis-in.conf中加入

实现本地文件获取数据写到redis 大致替换output如下 shipper.conf
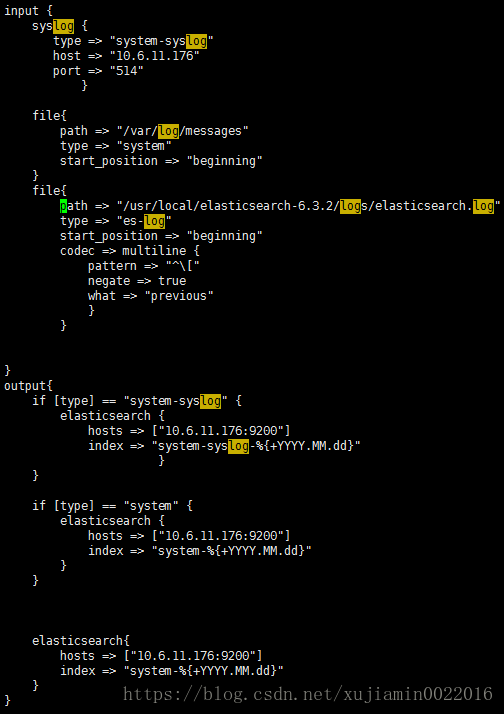
| input { syslog { type => "system-syslog" host => "10.6.11.176" port => "514" }
file { path => "/var/log/messages" type => "system" start_position => "beginning" } file { path => "/usr/local/elasticsearch-6.3.2/logs/elasticsearch.log" type => "es-log" start_position => "beginning" codec => multiline { pattern => "^\[" negate => true what => "previous" } } file{ path => "/var/log/nginx/access_json.log" codec => json start_position => "beginning" type => "nginx-log" } file { path => "/tmp/slow.log" type => "mysql-slow-log" start_position => "beginning" codec => multiline { pattern => "^# User@Host:" negate => true what => "previous" } } } output{ if [type] == "system-syslog" { redis { host => "10.6.11.176" port => "6379" password => "Hangzhou@123" db => "6" data_type => "list" key => "system-syslog" } }
if [type] == "system" { redis { host => "10.6.11.176" port => "6379" password => "Hangzhou@123" db => "6" data_type => "list" key => "system" } }
if [type] == "nginx-log" { redis { host => "10.6.11.176" port => "6379" password => "Hangzhou@123" db => "6" data_type => "list" key => "nginx-log" } } } |
从redis 读 写入es
/usr/local/logstash-6.3.2/bin/logstash -f /usr/local/logstash-6.3.2/config/redis-out.conf
| #从redis读 往es写 input { redis { type => "system" host => "10.6.11.176" port => "6379" password => "Hangzhou@123" db => "6" data_type => "list" key => "system" }
redis { type => "nginx-log" host => "10.6.11.176" port => "6379" password => "Hangzhou@123" db => "6" data_type => "list" key => "nginx-log" }
redis { type => "system-syslog" host => "10.6.11.176" port => "6379" password => "Hangzhou@123" db => "6" data_type => "list" key => "system-syslog" } }
output { if [type] == "system-syslog" { elasticsearch { hosts => ["10.6.11.176:9200"] index => "system-syslog-%{+YYYY.MM.dd}" } }
if [type] == "system" { elasticsearch { hosts => ["10.6.11.176:9200"] index => "system-%{+YYYY.MM.dd}" } } if [type] == "nginx-log" { elasticsearch { hosts => ["10.6.11.176:9200"] index => "nginx-log-%{+YYYY.MM.dd}" } } if [type] == "mysql-slow-log" { elasticsearch { hosts => ["10.6.11.176:9200"] index => "mysql-slow-log-%{+YYYY.MM.dd}" } } } |
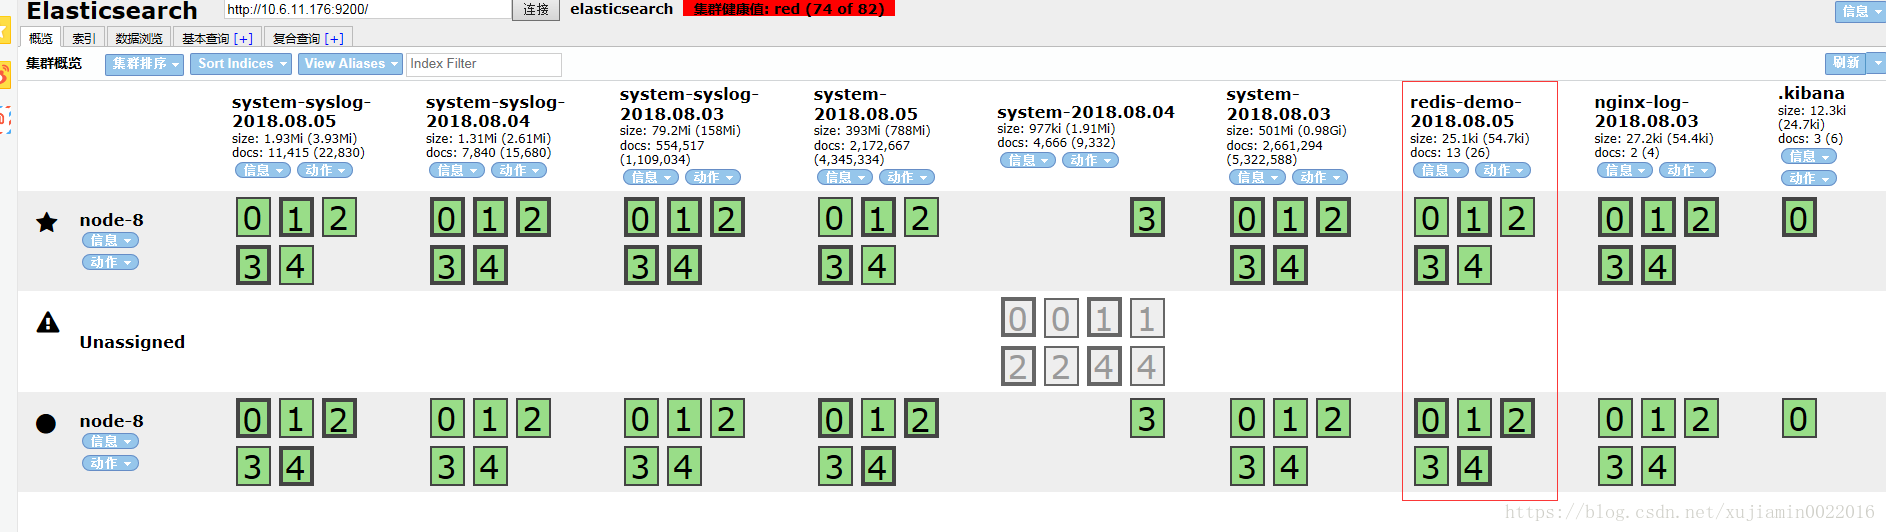
由于nginx-log的key的值少 所以一下子就读进去 然后key就消失了
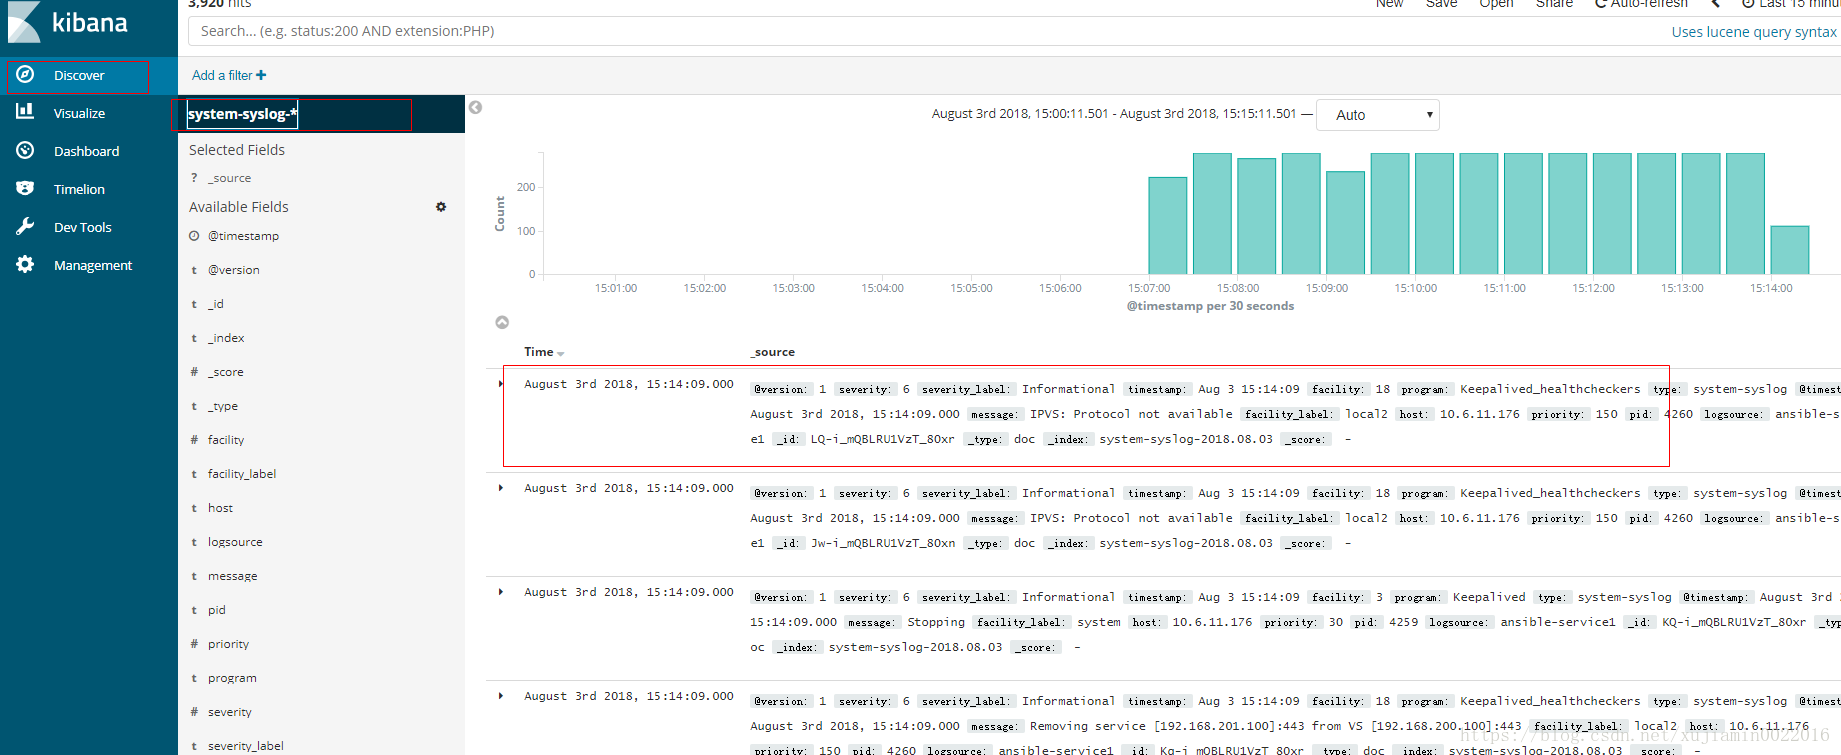
kibana中 的确是有日志进来的

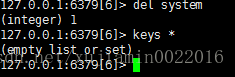
剩下的2个值太多了 比较慢 这边测试所以就直接删除掉key了
del system
cat 1.log |tee –a > 1.log
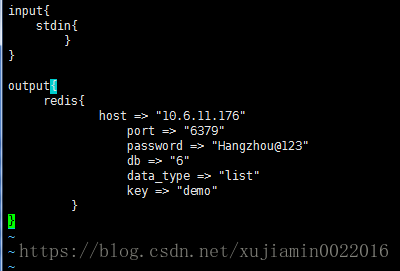
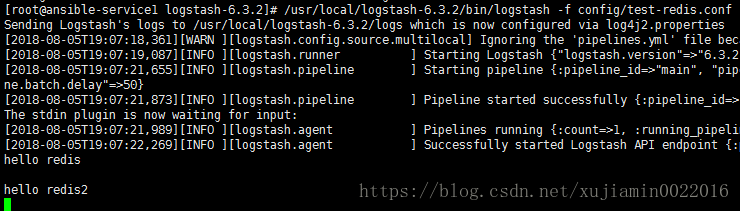
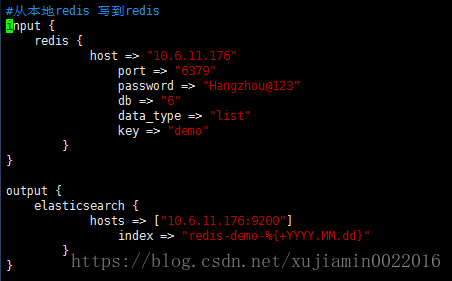
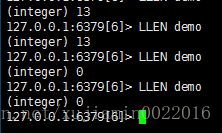
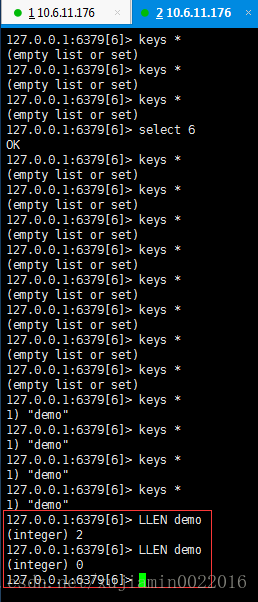
从本地redis 读 写入远程redis
/usr/local/logstash-6.3.2/bin/logstash -f redis-in.conf
| #从本地redis 写到远程redis input { redis { host => "10.6.11.176" port => "6379" password => "Hangzhou@123" db => "6" data_type => "list" key => "demo" } }
output { redis { host => "10.6.11.177" port => "6379" password => "Hangzhou@123" db => "6" data_type => "list" key => "demo" } } 执行之前
执行完之后 |
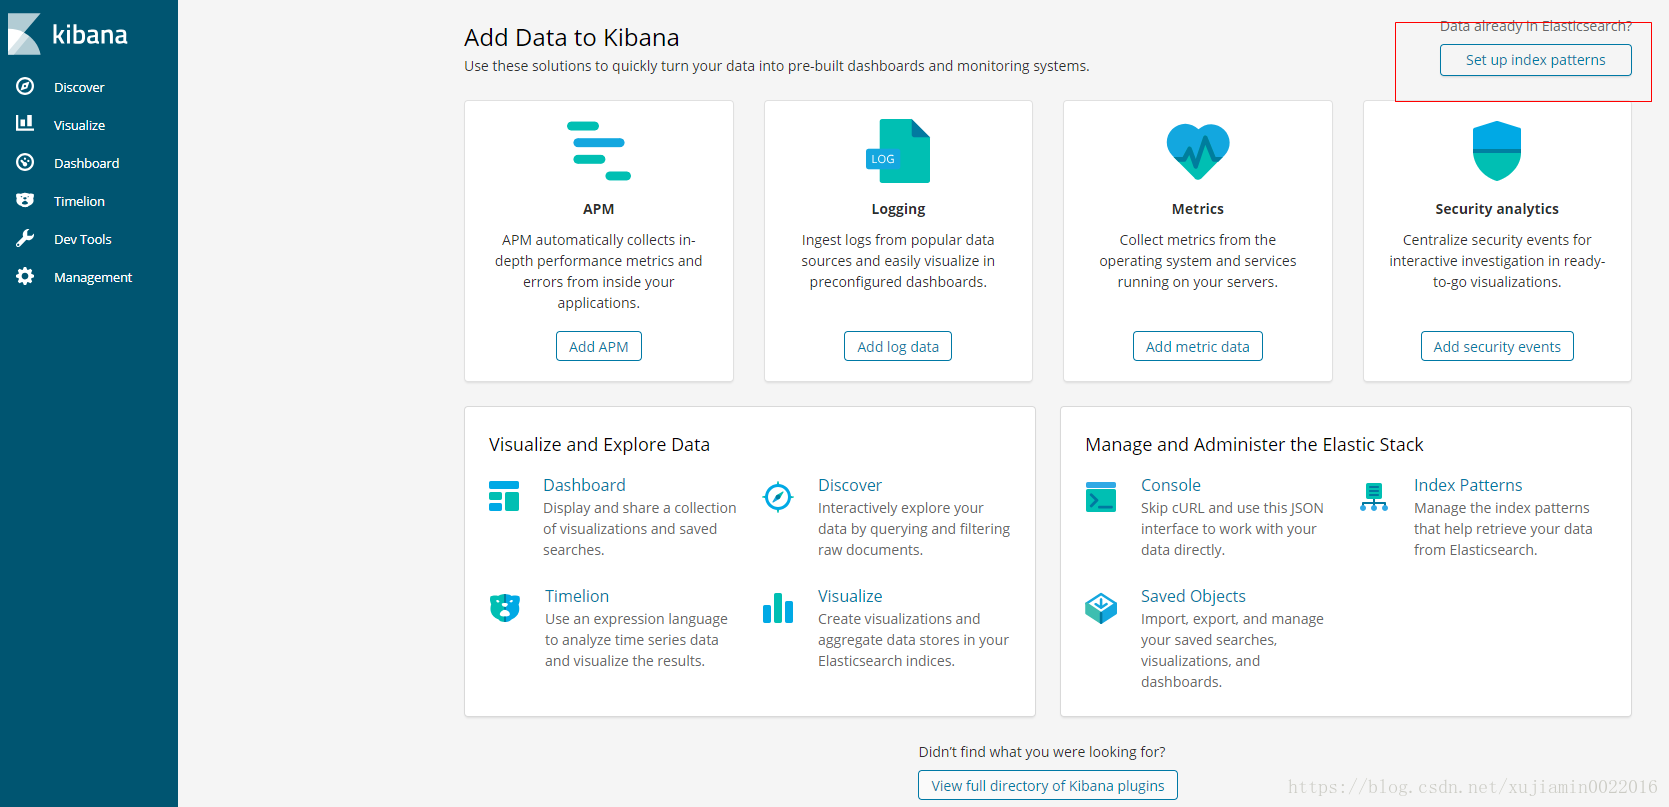
安装kibana
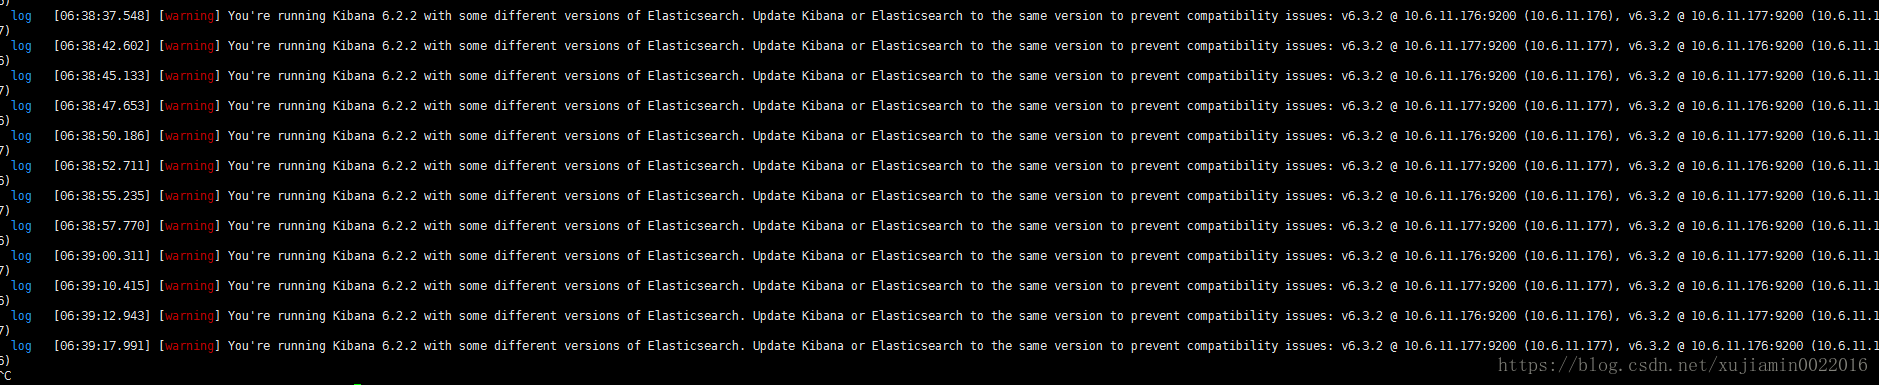
运行报错
es版本太低 低于kibana版本太多

kibana版本和es版本不一致的warning 不影响使用
先下载kibana安装包
解压
tar -xzf kibana-6.2.2-linux-x86_64.tar.gz -C /usr/local/
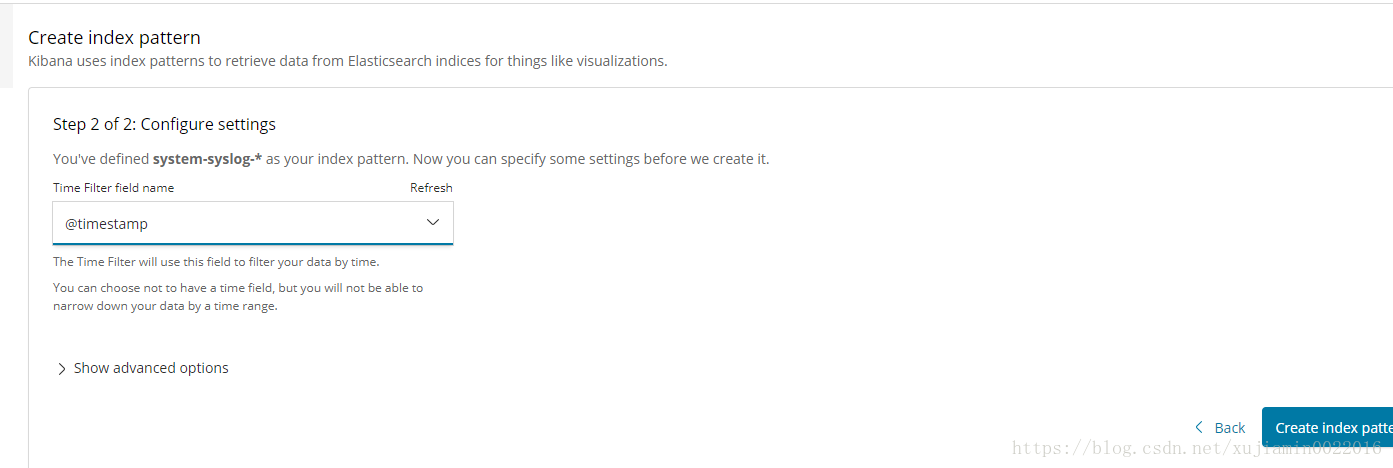
在kibana.yml中加入以下配置


kibana 用nginx 加auth 认证
一般一个es节点 带一个kibana 连本地es
然后nginx 负载均衡
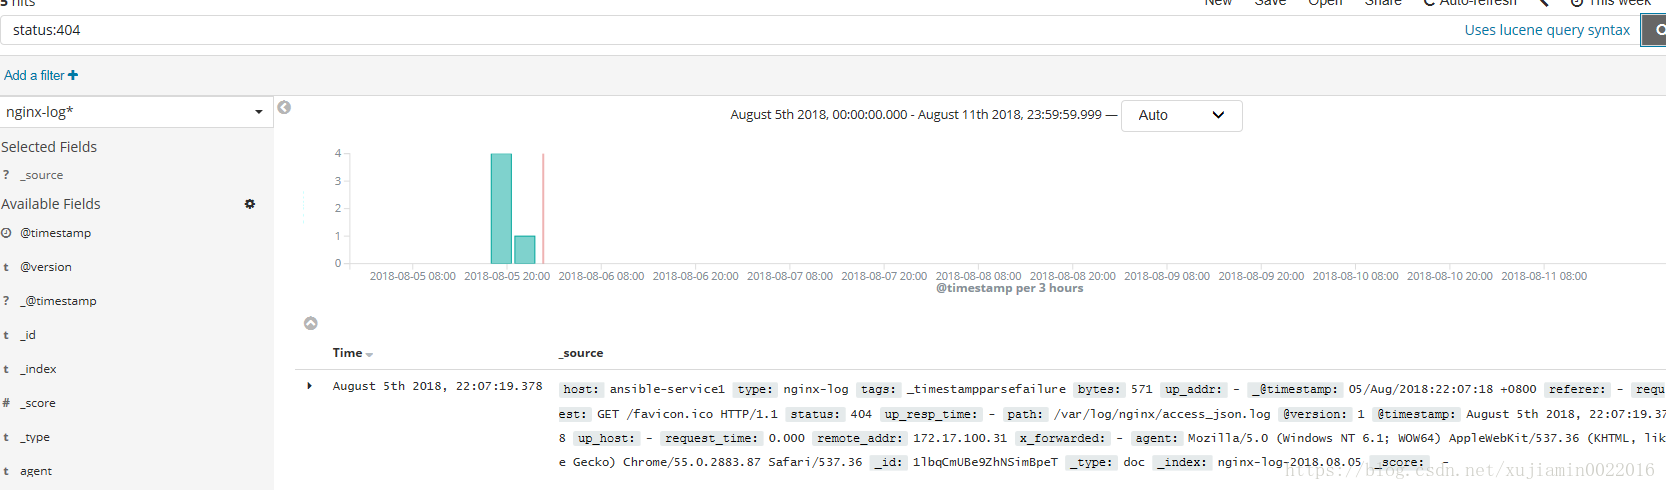
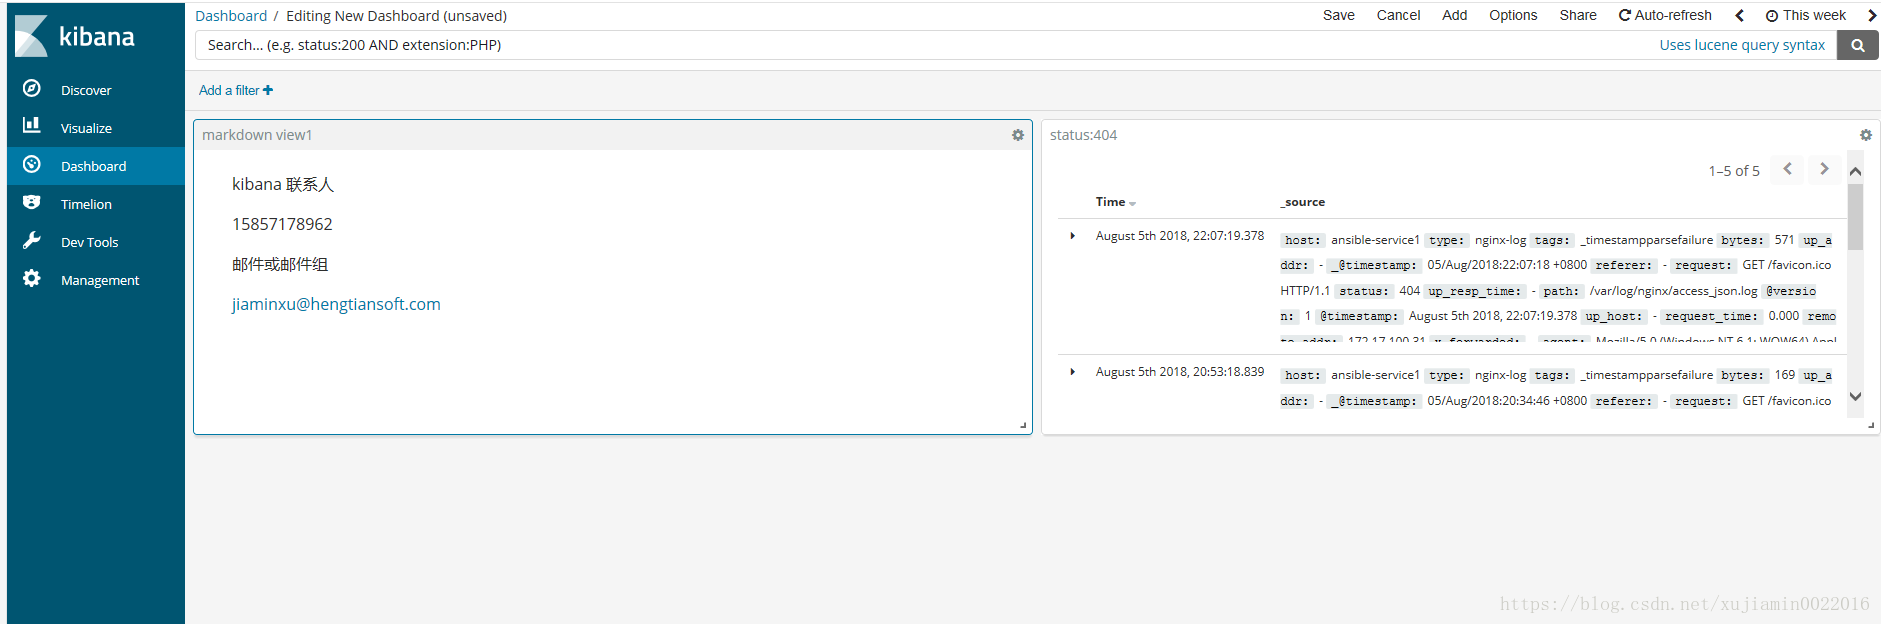
kibana 显示nginx 日志404
输入status:404
这边可能是由于这个日志的问题
显示不是很好看
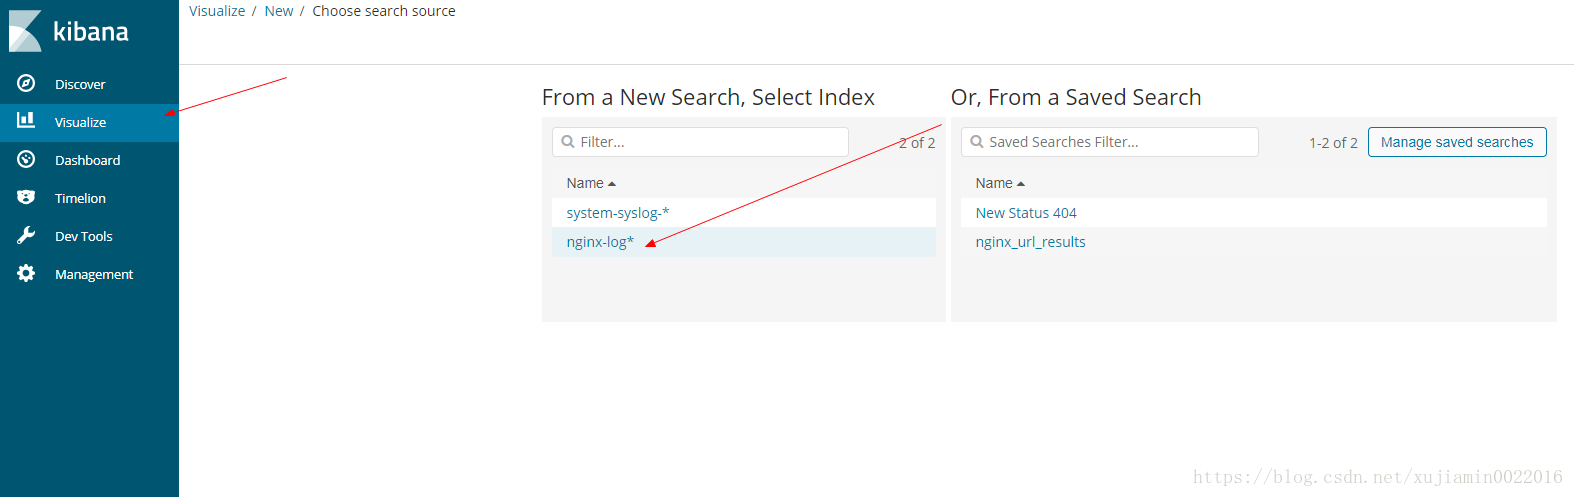
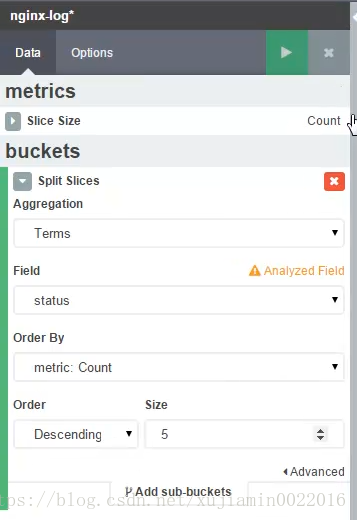
访问状态统计

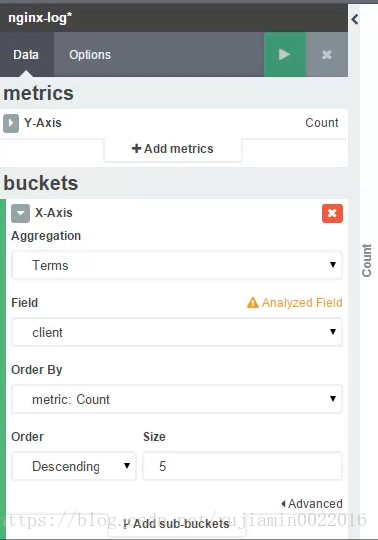
访问ip top5
创建dashboard
至此 elk的安装 以及配置介绍完毕