1.下载扩展:
windows:http://windows.php.net/downloads/pecl/releases/xhprof/0.10.6/
Linux:https://github.com/phacility/xhprof 或http://pecl.php.net/package/xhprof【下载最新版 网上分享的旧版有BUG (后面说)】
注意:
1.1 windows版本一定要下载PHP版本对应的xhprof不然无效
1.2 32位64位最好对应;我电脑是64的 但我下载的是32位的5.4 也能使用;
1.3 Liunx版本有写好的例子以及图形显示代码,也下载一份
2.安装
2.1 解压下载的windows版
2.2 将windows版的dll文件放到PHP的扩展目录 修改PHP.ini如下
[xhprof]
extension=php_xhprof.dll
; directory used by default implementation of the iXHProfRuns
; interface (namely, the XHProfRuns_Default class) for storing
; XHProf runs.
xhprof.output_dir="D:/phpStudy/PHPTutorial/tmp/xhprof"
2.3 out_dir 定义输出文件的存放位置 我用的phpstudy集成环境就存放在了tmp下
2.4 重启apache,查看phpinfo即可(如果下载的版本和PHP版本不一致 重启也看不见扩展的)
3.使用
3.1 解压下载的Linux版本
3.2 将examples xhprof_html xhprof_lib目录移到自己的PHP工作目录并按需求重命名(我将后两个文件移到examples目录了)
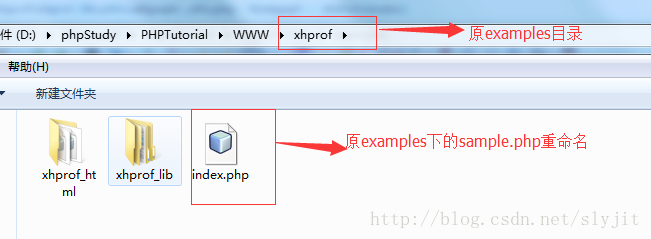
3.3 运行index.php http://localhost/xhprof/;index.php源码如下
<?php
function bar($x) {
  if ($x > 0) {
    bar($x - 1);
  }
}

function foo() {
  for ($idx = 0; $idx < 5; $idx++) {
    bar($idx);
    $x = strlen("abc");
  }
}

// start profiling
xhprof_enable();

// run program
foo();

// stop profiler
$xhprof_data = xhprof_disable();

// display raw xhprof data for the profiler run
print_r($xhprof_data);


include_once  "./xhprof_lib/utils/xhprof_lib.php";
include_once "./xhprof_lib/utils/xhprof_runs.php";

// save raw data for this profiler run using default
// implementation of iXHProfRuns.
$xhprof_runs = new XHProfRuns_Default();

// save the run under a namespace "xhprof_foo"
$run_id = $xhprof_runs->save_run($xhprof_data, "xhprof_foo");//查看分析结果需要用到

echo "---------------\n".
     "Assuming you have set up the http based UI for \n".
     "XHProf at some address, you can view run at \n".
"http://xhprof_html文件所在目录地址/index.php?run=$run_id&source=xhprof_foo\n";//xhprof_html文件所在目录地址一定给对
3.3.1 关于xhprof_enable函数 提供了两个参数 xhprof_enable ([ int $flags = 0 [, array $options ]] )
flags 该参数用于为剖析结果添加额外的信息,该参数的值使用以下宏,如果需要提供多个值,使用|进行分隔。
XHPROFFLAGSNO_BUILTINS 跳过所有的内置函数
XHPROFFLAGSCPU 添加对CPU使用的分析
XHPROFFLAGSMEMORY 添加对内存使用的分析
注:在Linux环境下,XHPROFFLAGSCPU会造成比较高的系统负载,因此不建议使用,而推荐只使用XHPROF_FLAGS_MEMORY
3.4 查看分析:http://localhost/xhprof/xhprof_html/index.php?run=5a5ede10a5244&source=xhprof_foo
3.5 点击页面中间的[View Full Callgraph]可查看图形分析结果
4.关于View Full Callgraph
打开View Full Callgraph可能会出现如下错误:
4.1
failed to execute cmd: " dot -Tpng". stderr: `'dot' 不是内部或外部命令,也不是可运行的程序 或批处理文件。 '这是因为本地没有安装Graphviz2.38或给定dot命令路径不对,下载地址http://www.graphviz.org/download/ 或者百度下载http://rj.baidu.com/soft/detail/19179.html?ald
下载之后正常安装即可 即可安装路径 我的安装路径是D:\Program Files\Graphviz2.38
4.2 修改xhprof\xhprof_lib\utils\callgraph_utils.php的第110行如下
  //$cmd = " dot -T".$type;
  $cmd = '"D:\Program Files\Graphviz2.38\bin/dot" -T'.$type;
4.3 再次运行可能会报错
Warning: proc_open(): CreateProcess failed, error code - 267 in D:\phpStudy\PHPTutorial\WWW\xhprof\xhprof_lib\utils\callgraph_utils.php on line 114
failed to execute cmd ""D:\Program Files\Graphviz2.38\bin/dot" -Tpng"
出现这种状况的原因下载了旧的Liunx版本的UI,在112行修改如下
  //$process = proc_open($cmd, $descriptorspec, $pipes, "/tmp", array());
  $process = proc_open($cmd, $descriptorspec, $pipes,sys_get_temp_dir());
或者直接在D盘根目录下创建一个tmp文件即可
5.关于xhGUI
6总结
记得xhprof_html与xhprof_lib在同一目录,因为xhprof_html包含了xhprof_lib,如更改目录 记得修改xhprof_html的代码;
以上是我在安装时候遇到一些问题
其它问题 见官方手册 http://php.net/manual/zh/book.xhprof.php