k线系列目录
查看目录请点击这儿
提出问题
记得曾经有一个脑筋急转弯:
问:如何把大象装进冰箱里?
答:总共分三步(1)把冰箱门开起来(2)把大象推进去(3)把冰箱门关上
虽然是一个笑话,但是从另一种角度来讲也是一种解决问题的思路。2008年北京奥运会作为一个大型项目,时长持续8年之久,可是项目的过程也仅仅只分为五个过程组:
(1)启动过程组(2)规划过程组(3)执行过程组(4)监控过程组(5)收尾过程组
那对于我们的主题:分时图,其实也可以这样看待。如何绘制一张分时图,如果你看过前面几篇的文章(没看过的点这儿),心里应该会有个大体的过程:
- 绘制分时图的边框
- 绘制分时图的X轴时间点
- 绘制价格区间标识
- 绘制分时线
- 绘制均线
- 绘制呼吸灯
完成6个步骤,那一个分时图就已经绘制完成。
开始搞起
有了思路,就开始干活!虽然在前几篇文章中有说过一些绘制的方法,这里就再说一次,权当复习。
(一)绘制分时图边框
要实现的效果是一个6 * 4 方格的边框,如下图:
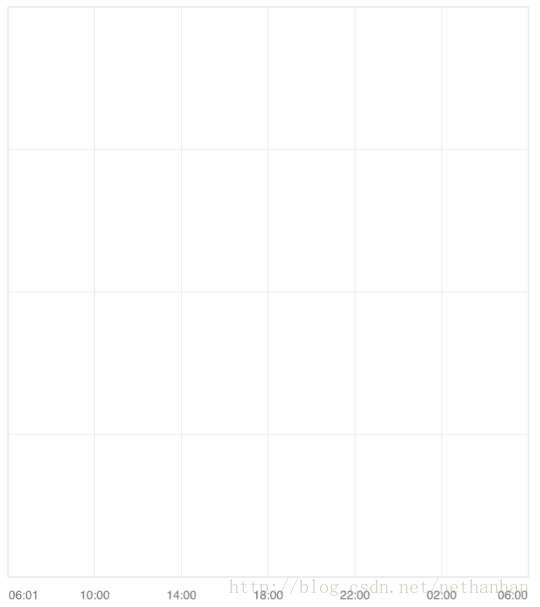
那就是说,我们分两个for循环,来完成横向7条线、竖向5条线的绘制工作。上代码!
    CGRect rect = CGRectMake(frameX, frameY, frameW, frameH);
    UIBezierPath *framePath = [UIBezierPath bezierPathWithRect:rect];
    CAShapeLayer *layer = [CAShapeLayer layer];

    float unitW = frameW/6;
    float unitH = frameH/4;
    //绘制7条竖线
    for (int idx=0; idx<7; idx++)
    {
        CGPoint startPoint = CGPointMake(frameX + unitW * idx, frameY);
        CGPoint endPoint   = CGPointMake(frameX + unitW * idx, frameY + frameH);
        [framePath moveToPoint:startPoint];
        [framePath addLineToPoint:endPoint];
    }
    //绘制5条横线
    for (int idx=0; idx<5; idx++)
    {
        CGPoint startPoint = CGPointMake(frameX, frameY + unitH * idx);
        CGPoint endPoint   = CGPointMake(frameX + frameW, frameY + unitH * idx);
        [framePath moveToPoint:startPoint];
        [framePath addLineToPoint:endPoint];
    }
    //设置图层的属性
    layer.path = framePath.CGPath;
    layer.lineWidth = 0.5f;
    layer.strokeColor = [UIColor colorWithRed:220.f/255.f green:220.f/255.f blue:220.f/255.f alpha:1.f].CGColor;
    layer.fillColor = [UIColor clearColor].CGColor;
(二)绘制分时图的X轴时间点
框绘制完成以后,就开始绘制边框最下方的时间点,由于现货类K线框架默认交易时间为24小时,所以时间也设置为6.01至6.00。这样的话,每4个小时一个方格,共需要绘制7个时间点。代码如下:
    //坐标点数组
    NSArray *timePointArr = @[@"06:01", @"10:00", @"14:00", @"18:00", @"22:00", @"02:00", @"06:00"];
    NSDictionary *attribute = @{NSFontAttributeName:[UIFont systemFontOfSize:9.f]};
    CGRect strRect = [self rectOfNSString:@"00:00" attribute:attribute];
    float strW = CGRectGetWidth(strRect);
    float strH = CGRectGetHeight(strRect);

    float unitW = CGRectGetWidth(self.frame) / 6;
    //循环绘制坐标点
    for (int idx = 0; idx < timePointArr.count; idx++)
    {
        CATextLayer *textLayer = nil;

        if (idx == timePointArr.count-1)
        {//最后一个
            CGRect rect = CGRectMake(idx * unitW - strW, CGRectGetHeight(self.frame)-timePointH, strW, strH);
            textLayer = [CATextLayer getTextLayerWithString:timePointArr[idx] textColor:[UIColor blackColor] fontSize:9.f backgroundColor:[UIColor clearColor] frame:rect];
        }else if(idx == 0)
        {//第一个
            CGRect rect = CGRectMake(idx * unitW, CGRectGetHeight(self.frame)-timePointH, strW, strH);
            textLayer = [CATextLayer getTextLayerWithString:timePointArr[idx] textColor:[UIColor blackColor] fontSize:9.f backgroundColor:[UIColor clearColor] frame:rect];
        }else
        {//中间
            CGRect rect = CGRectMake(idx * unitW - strW/2, CGRectGetHeight(self.frame)-timePointH, strW, strH);
            textLayer = [CATextLayer getTextLayerWithString:timePointArr[idx] textColor:[UIColor blackColor] fontSize:9.f backgroundColor:[UIColor clearColor] frame:rect];
        }

        [self.layer addSublayer:textLayer];
    }
(三)绘制价格区间标识
到现在,边框和时间点绘制完成。接下来,再绘制价格区间。价格区间的求法是先要出极限值,也就是最大值最小值,然后按下列的规则得出:
if(ABS(当前分时线中最大值 - 昨日收盘价)) >= (ABS(昨日收盘价-当前分时线中最小值))
{
最上侧价格 = 当前分时线中最大值;
最下侧价格 = 昨日收盘价 - ABS(当前分时线中最大值 - 昨日收盘价);
}else
{
最上侧价格 = 昨日收盘价 + ABS(昨日收盘价-当前分时线中最小值);
最下侧价格 = 当前分时线中最小值;
}
代码如下:
    //循环绘制5行数据
    //左边是价格  右边是百分比
    for (int idx = 0; idx < 5; idx++)
    {
        float height = 0.f;
        if (idx == 4)
        {
            height = idx * unitH - CGRectGetHeight(priceRect);
        } else
        {
            height = idx * unitH;
        }
        CGRect leftRect = CGRectMake(0,
                                     height,
                                     CGRectGetWidth(priceRect),
                                     CGRectGetHeight(priceRect));
        CGRect rightRect = CGRectMake(CGRectGetMaxX(self.frame)-CGRectGetWidth(perRect)-14,
                                      height,
                                      CGRectGetWidth(perRect),
                                      CGRectGetHeight(perRect));
        //计算价格和百分比
        NSString *leftStr = [NSString stringWithFormat:@"%.2f", self.maxValue - idx * unitPrice];
        NSString *rightStr = [NSString stringWithFormat:@"%.2f%%", (self.maxValue - idx * unitPrice - self.yc)/self.yc];

        CATextLayer *leftLayer = [CATextLayer getTextLayerWithString:leftStr
                                                           textColor:[UIColor blackColor]
                                                            fontSize:9.f
                                                     backgroundColor:[UIColor clearColor]
                                                               frame:leftRect];
        CATextLayer *rightLayer = [CATextLayer getTextLayerWithString:rightStr
                                                            textColor:[UIColor blackColor]
                                                             fontSize:9.f
                                                      backgroundColor:[UIColor clearColor]
                                                                frame:rightRect];

        [self.layer addSublayer:leftLayer];
        [self.layer addSublayer:rightLayer];
    }
(四)绘制分时线
左右的价格区间绘制完以后,接下来是绘制分时线。
1、这里要注意,因为默认是24小时的交易时间,那分时线是每一个点为一分钟,24小时换算成分钟是1440分钟。
2、使用边框的宽 除以 1440,就可以得出每一个点做占的宽,这样在转换每一个分时点的坐标时,x值就可以使用这个宽得出。
3、那每一个分时点的y值是如何求出的?是先用最大值减去最小值得出边框高所对应的值,然后用这个值除以边框高,就得出单位值所对应的高,那求y值时就可以直接用这个值。
转换代码如下:
    CGFloat unitW = CGRectGetWidth(self.frame) / 1440;
    CGFloat unitValue = (self.maxValue - self.minValue) / (CGRectGetHeight(self.frame) - timePointH);

    NSMutableArray *pointArr = [NSMutableArray array];
    //遍历数据模型
    [self.timeCharModelArr enumerateObjectsUsingBlock:^(YKTimeChartModel * _Nonnull model, NSUInteger idx, BOOL * _Nonnull stop) {

        CGFloat x = idx * unitW;
        //生成分时线坐标点
        CGPoint linePoint = CGPointMake(x, ABS(CGRectGetMaxY(self.frame) - timePointH) - (model.clp - self.minValue)/ unitValue);
        //生成均线坐标点
        CGPoint avgPoint = CGPointMake(x, ABS(CGRectGetMaxY(self.frame) - timePointH) - (model.avp - self.minValue)/ unitValue);

        YKTimeLinePointModel *pointModel = [YKTimeLinePointModel new];
        pointModel.linePoint = linePoint;
        pointModel.avgPoint = avgPoint;
        [pointArr addObject:pointModel];
    }];

    return pointArr;
那每一个分时线的点的坐标全部转换完以后,我们就可以直接遍历这个数组来循环绘制了。上代码:
    //绘制分时线
    YKTimeLinePointModel *firstModel = pointArr.firstObject;
    [timeLinePath moveToPoint:firstModel.linePoint];
    for (int i=1; i<pointArr.count; i++)
    {
        YKTimeLinePointModel *model = pointArr[i];
        [timeLinePath addLineToPoint:model.linePoint];
    }
    lineLayer.path = timeLinePath.CGPath;
    lineLayer.lineWidth = 0.4f;
    lineLayer.strokeColor = [UIColor colorWithRed:100.f/255.f green:149.f/255.f blue:237.f/255.f alpha:1.f].CGColor;
    lineLayer.fillColor = [UIColor clearColor].CGColor;

    //绘制背景区域
    YKTimeLinePointModel *lastModel = [pointArr lastObject];
    [timeLinePath addLineToPoint:CGPointMake(lastModel.linePoint.x, CGRectGetHeight(self.frame) - timePointH)];
    [timeLinePath addLineToPoint:CGPointMake(firstModel.linePoint.x, CGRectGetHeight(self.frame)- timePointH)];
    fillLayer.path = timeLinePath.CGPath;
    fillLayer.fillColor = [UIColor colorWithRed:135.f/255.f green:206.f/255.f blue:250.f/255.f alpha:0.5f].CGColor;
    fillLayer.strokeColor = [UIColor clearColor].CGColor;
    fillLayer.zPosition -= 1;
(五)绘制均线
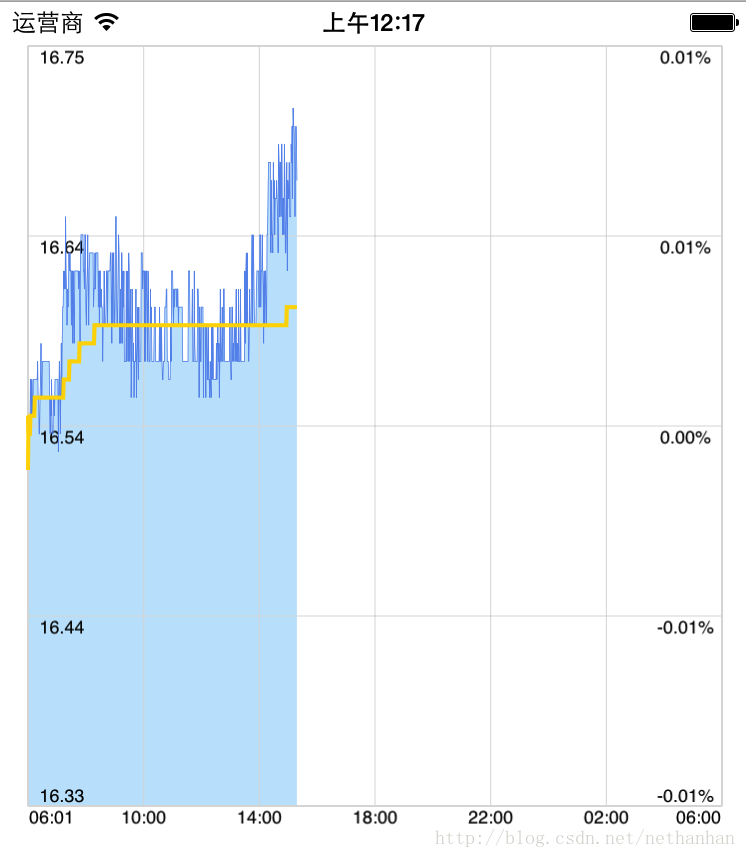
分时线绘制完以后,接着绘制均线,也就是那根黄色的线:
    CAShapeLayer *avgLineLayer = [CAShapeLayer layer];

    UIBezierPath *avgLinePath = [UIBezierPath bezierPath];
    YKTimeLinePointModel *firstModel = pointArr.firstObject;
    [avgLinePath moveToPoint:firstModel.avgPoint];

    for (int i=1; i<pointArr.count; i++)
    {
        YKTimeLinePointModel *model = pointArr[i];
        [avgLinePath addLineToPoint:model.avgPoint];
    }

    avgLineLayer.path = avgLinePath.CGPath;
    avgLineLayer.lineWidth = 2.f;
    avgLineLayer.strokeColor = [UIColor colorWithRed:255.f/255.f green:215.f/255.f blue:0.f/255.f alpha:1.f].CGColor;
    avgLineLayer.fillColor = [UIColor clearColor].CGColor;
至此,我们已经把分时图绘制完成,来看看我们的成果吧!
(六)绘制呼吸灯
怎么样? 是不是感觉很棒?不过刚才差点忘了一个元素,就是呼吸灯效果,它可是最能反映我们的分时图动态效果的地方。
那接着上代码吧!(如果对CABasicAnimation不是太了解的话,点击这儿,有详细介绍)
/**
 绘制呼吸灯
 */
- (void)drawBreathingLightWithPoint:(CGPoint)point
{
    CALayer *layer = [CALayer layer];
    //设置任意位置
    layer.frame = CGRectMake(point.x, point.y, 3, 3);
    //设置呼吸灯的颜色
    layer.backgroundColor = [UIColor blueColor].CGColor;
    //设置好半径
    layer.cornerRadius = 1.5;
    //给当前图层添加动画组
    [layer addAnimation:[self createBreathingLightAnimationWithTime:2] forKey:nil];

    [self.layer addSublayer:layer];
}


/**
 生成动画

 @param time 动画单词持续时间
 @return 返回动画组
 */
- (CAAnimationGroup *)createBreathingLightAnimationWithTime:(double)time
{
    //实例化CABasicAnimation
    CABasicAnimation *scaleAnimation = [CABasicAnimation animationWithKeyPath:@"transform.scale"];
    //从1开始
    scaleAnimation.fromValue = @1;
    //到3.5
    scaleAnimation.toValue = @3.5;
    //结束后不执行逆动画
    scaleAnimation.autoreverses = NO;
    //无限循环
    scaleAnimation.repeatCount = HUGE_VALF;
    //一次执行time秒
    scaleAnimation.duration = time;
    //结束后从渲染树删除,变回初始状态
    scaleAnimation.removedOnCompletion = YES;
    scaleAnimation.fillMode = kCAFillModeForwards;

    CABasicAnimation *opacityAnimation = [CABasicAnimation animationWithKeyPath:@"opacity"];
    opacityAnimation.fromValue = @1.0;
    opacityAnimation.toValue = @0;
    opacityAnimation.autoreverses = NO;
    opacityAnimation.repeatCount = HUGE_VALF;
    opacityAnimation.duration = time;
    opacityAnimation.removedOnCompletion = YES;
    opacityAnimation.fillMode = kCAFillModeForwards;

    CAAnimationGroup *group = [CAAnimationGroup animation];
    group.duration = time;
    group.autoreverses = NO;
    group.animations = @[scaleAnimation, opacityAnimation];
    group.repeatCount = HUGE_VALF;
    //这里也应该设置removedOnCompletion和fillMode属性,以具体情况而定

    return group;
}
最终的效果如下(特意上传了一个gif图):
好啦,我们的分时图最终大功告成。但先别急着太高兴,其实还有很多欠缺的地方,比如:
- 主题、颜色是不是需要可配置?
- 参数、大小是不是需要动态自适应?
- 边框线段是不是要可自定义?比如来个其他颜色的虚线?
- 这可是现货类?股票类的X轴怎么修改?
- demo的源码如何修改变成强扩展的框架的一部分呢?
- …….
还有很多地方、很多效果值得我们去细细打磨它!如果有需要讨论的地方,随时欢迎拍砖灌水!
最后献上demo源码一份,拿走不谢!点这里。