 1  load_data = sio.loadmat(load_path)
 2
 3     #阈值处理
 4       mat=np.array(load_data['R'])
 5       mat[mat<0]=0
 6       mat[mat<0.45]=0
 7
 8     #写入txt文件
 9      # np.savetxt(thr_path, mat);
10
11       #计算degree
12       g = nx.Graph()
13       for i in range(len(mat)):
14           for j in range(len(mat)):
15               if(mat[i,j]>0):  #删除边的权重小于等于0的边
16                 g.add_edge(i, j,weight=mat[i,j])
17
18       # nx.draw(g)
19       # nx.draw(g,with_labels=True)  # 将标号标出来
20       # plt.show()
21
22       # 按权重划分为重权值得边和轻权值的边
23       elarge = [(u, v) for (u, v, d) in g.edges(data=True) if d['weight'] > 0.5]
24       esmall = [(u, v) for (u, v, d) in g.edges(data=True) if d['weight'] <= 0.5]
25       # 节点位置
26       pos = nx.spring_layout(g)  # positions for all nodes
27       # 首先画出节点位置
28       # nodes
29       nx.draw_networkx_nodes(g, pos, node_color='b',node_size=300,alpha=0.4)
30       # 根据权重,实线为权值大的边,虚线为权值小的边
31       # edges
32       nx.draw_networkx_edges(g, pos, edgelist=elarge,
33                              width=3)
34       nx.draw_networkx_edges(g, pos, edgelist=esmall,
35                              width=1, alpha=0.5, edge_color='g', style='dashed')
36
37       # labels标签定义
38       nx.draw_networkx_labels(g, pos, font_size=13, font_family='sans-serif')
39
40       plt.axis('off')
41       plt.savefig("weighted_graph.png")  # save as png
42       plt.show()
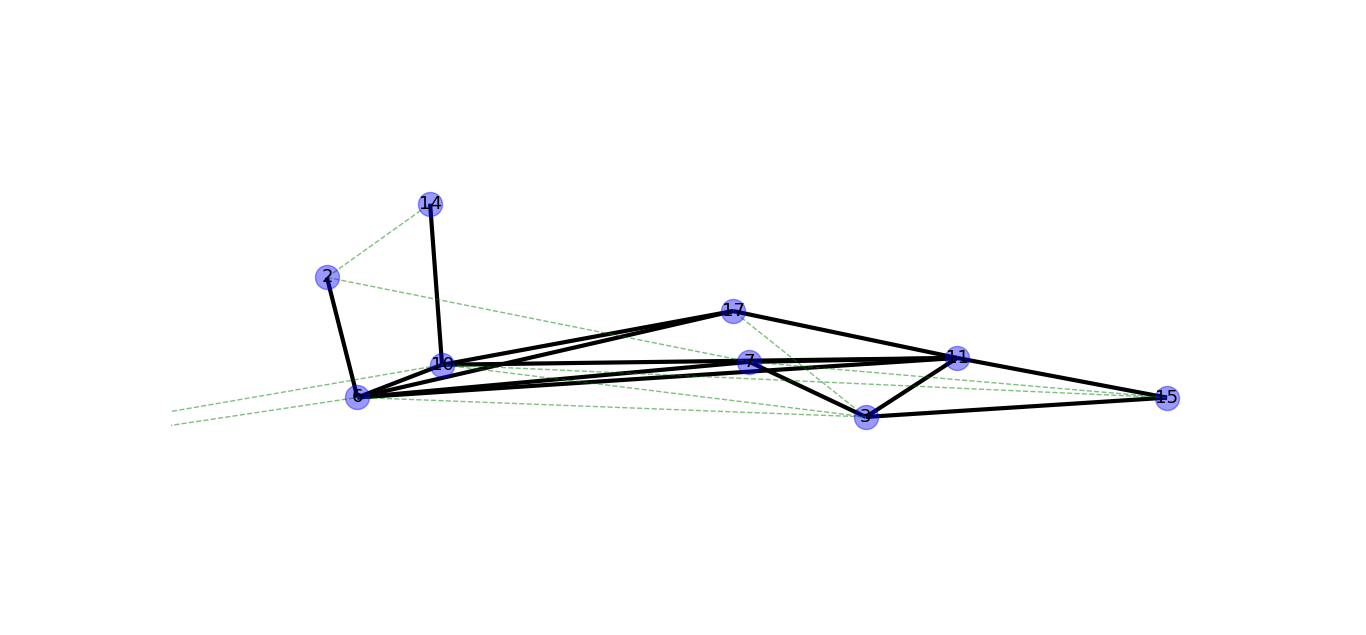
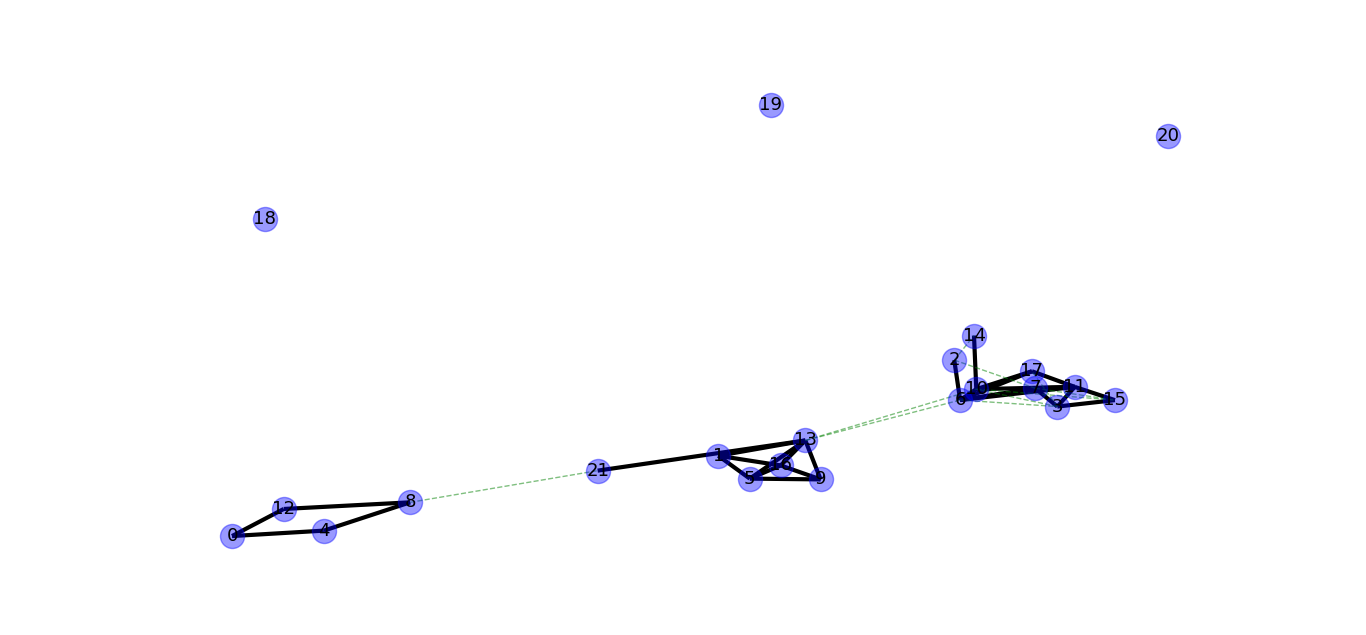
Result:
局部放大: