Brendan Gregg曾经分享过当遇到一个系统性能问题时,如何利用登录的前60秒对系统的性能情况做一个快速浏览和分析,主要包括如下10个工具,这是一个非常有用且有效的命工具列表。本文将详细介绍这些命令及其扩展选项的意义,及其在实践中的作用。并利用一个实际出现问题的例子,来验证这些套路是不是可行,下面工具的屏幕输出结果都来自这个出现题的系统。
# 系统负载概览
uptime# 系统日志
dmesg | tail# CPU
vmstat 1
mpstat -P ALL 1
pidstat 1# Disk
iostat -xz 1# 内存
free -m# 网络
sar -n DEV 1
sar -n TCP,ETCP 1# 系统概览
top
上面的工具都基于内核提供给用户态的统计,并以计数器形式展示,是快速排查时的利器。对于应用和系统的进一步跟踪(tracing),则需要利用strace和systemtap,不在本文的范畴。
注意:
- 如上的分类只是基于工具默认选项的分类,比如pidstat,默认展示进程的CPU统计,但是利用-d参数可以展示进程的I/O统计。又比如vmstat,虽然名称是查看虚拟内存的工具,但默认展示了负载,内存,I/O,系统,CPU等多方面的信息。
- 部分工具需要安装sysstat包。
1. uptime
[root@nginx1 ~]# uptime
 15:38:10 up 43 days,  3:54,  1 user,  load average: 1.13, 0.41, 0.18
uptime是快速查看load average的方法,在Linux中load average包括处于runnable和uninterruptable状态的进程总数,runnable状态的进程包括在CPU上运行的进程和已经ready to run在等待CPU时间的进程;uninterruptable状态的进程是在等待一些I/O访问,比如等待disk的返回。Load average没有根据系统的CPU数量做格式化,所以load average 1表示单CPU系统在对应时间段内(1分钟, 5分钟, 15分钟)一直负载饱和,而在4 CPU的系统中,load average 1表示有75%的时间在idle。
Load average体现了一个high level的负载概览,但是可能需要和别的工具一起来使用以了解更多信息,比如处于runable和uninterruptable的实时进程数量分别是多少,可以用下面将介绍到的vmstat来查看。1分钟,5分钟,15分钟的负载平均值同时能体现系统负载的变化情况。例如,如果你要检查一个问题服务器,当你看到1分钟的平均负载值已经远小于15分钟的平均负载值,则意味这也许你登录晚了点,错过了现场。用top或者w命令,也可以看到load average信息。
上面示例中最近1分钟内的负载比15分钟内的负载高了不少 (因为是个测试的例子,1.13可以看作明显大于0.18,但是在生产系统上这不能说明什么)。
2. dmesg | tail

[root@nginx1 ~]# dmesg | tail
[3128052.929139] device eth0 left promiscuous mode
[3128104.794514] device eth0 entered promiscuous mode
[3128526.750271] device eth0 left promiscuous mode
[3537292.096991] device eth0 entered promiscuous mode
[3537295.941952] device eth0 left promiscuous mode
[3537306.450497] device eth0 entered promiscuous mode
[3537307.884028] device eth0 left promiscuous mode
[3668025.020351] bash (8290): drop_caches: 1
[3674191.126305] bash (8290): drop_caches: 2
[3675304.139734] bash (8290): drop_caches: 1
dmesg用于查看内核缓冲区存放的系统信息。另外查看/var/log/messages也可能查看出服务器系统方面的某些问题。
上面示例中的dmesg没有特别的值得注意的错误。
3. vmstat 1

vmstat简介:
- vmstat是virtual memory stat的简写,能够打印processes, memory, paging, block IO, traps, disks and cpu的相关信息。
- vmstat的格式:vmstat [options] [delay [count]]。在输入中的1是延迟。第一行打印的是机器启动到现在的平均值,后面打印的则是根据deley间隔的取样结果,也就是实时的结果。
结果中列的含义:
Procs(进程)
r: The number of runnable processes (running or waiting for run time).
b: The number of processes in uninterruptible sleep.
注释:r表示在CPU上运行的进程和ready等待运行的进程总数,相比load average, 这个值更能判断CPU是否饱和(saturation),因为它没有包括I/O。如果r的值大于CPU数目,即达到饱和。
Memory
swpd: the amount of virtual memory used.
free: the amount of idle memory.
buff: the amount of memory used as buffers.
cache: the amount of memory used as cache.
Swap
si: Amount of memory swapped in from disk (/s).
so: Amount of memory swapped to disk (/s).
注释:swap-in和swap-out的内存。如果是非零,说明主存中的内存耗尽。
IO
bi: Blocks received from a block device (blocks/s).
bo: Blocks sent to a block device (blocks/s).
System (中断和进程上下文切换)
in: The number of interrupts per second, including the clock.
cs: The number of context switches per second.
CPU
These are percentages of total CPU time.
us: Time spent running non-kernel code. (user time, including nice time)
sy: Time spent running kernel code. (system time)
id: Time spent idle. Prior to Linux 2.5.41, this includes IO-wait time.
wa: Time spent waiting for IO. Prior to Linux 2.5.41, included in idle.
st: Time stolen from a virtual machine. Prior to Linux 2.6.11, unknown.
根据user+system时间,可以判断CPUs是否繁忙。如果wait I/O一直维持一定程度,说明disk有瓶颈,这时CPUs是"idle"的,因为任务都被block在等待disk I/O中。wait I/O可以被视为另一种形式的CPU idle,并且说明idle的原因就是在等待disk I/O的完成。
处理I/O需要花费system time,在将I/O提交到disk driver之前可能要经过remap, split和merge等操作,并被I/O scheduler调度到request queue。如果处理I/O时平均system time比较高,超过20%,则要进一步分析下,是不是内核处理I/O时的效率有问题。
如果用户空间的CPU使用率接近100%,不一定就代表有问题,可以结合r列的进程总数量看下CPU的饱和程度。
上面示例可以看到在CPU方面有一个明显的问题。user+system的CPU一直维持在50%左右,并且system消耗了大部分的CPU。
4. mpstat -P ALL 1
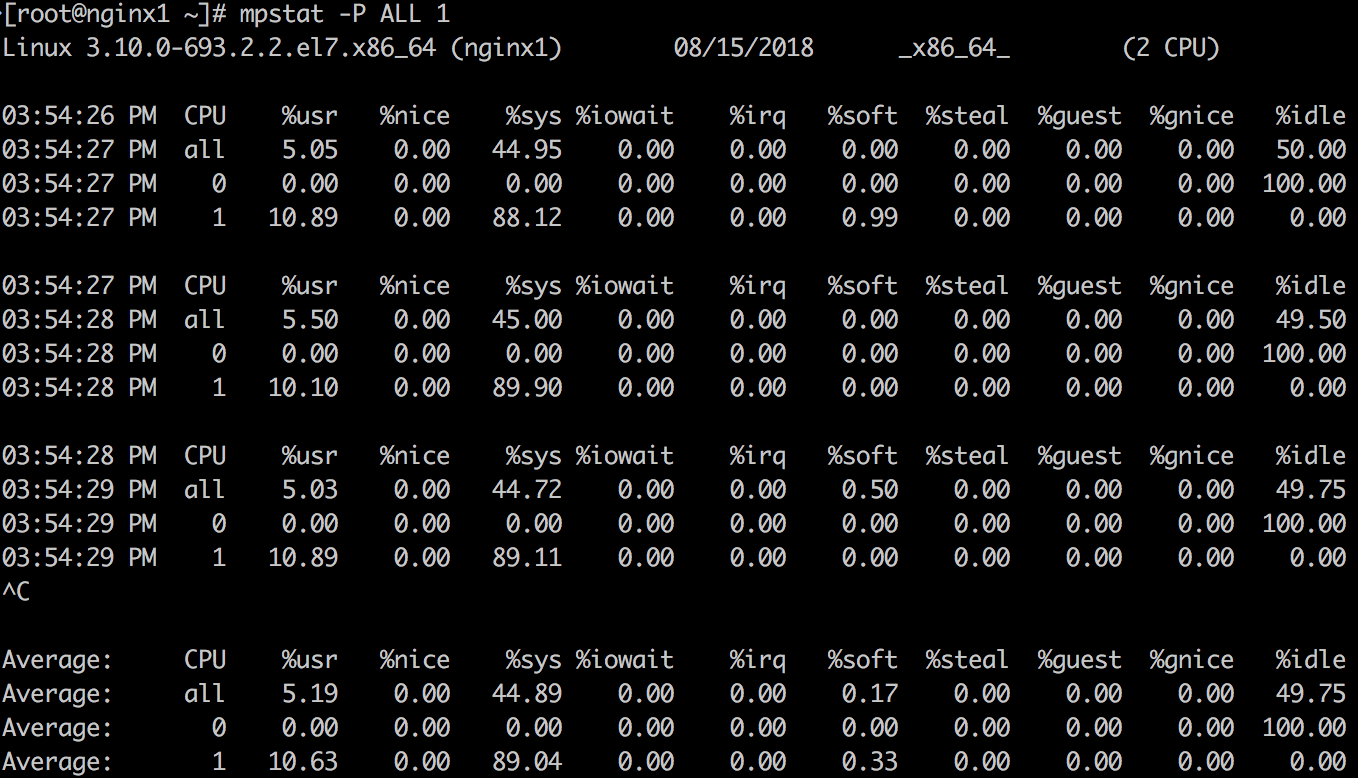
mpstat可以打印按照CPU的分解,可以用来检查不不均衡的情况。
上面示例结果可以印证vmstat中观察到的结论,并且可以看到服务器有2个CPU,其中CPU 1的使用率一直维持在100%,而CPU 0并没有什么负载。CPU 1的消耗主要在内核空间,而非用户空间。
5. pidstat 1
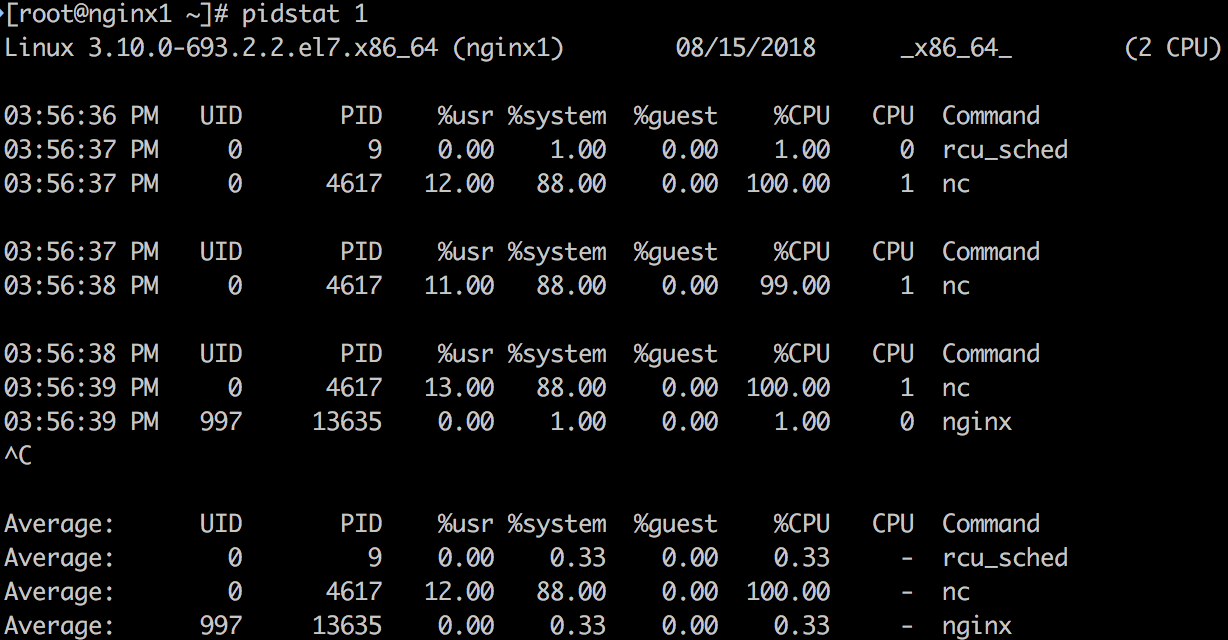
默认pidstat类似于top按照进程的打印方式,不过是以滚动打印的方式,和top的清屏方式不同。利用-p可以打出指定进程的信息,-p ALL可以打出所有进程的信息。如果没有指定任何进程默认相当于-p ALL,但是只打印活动进程的信息(统计非0的数据)。
pidstat不只可以打印进程的CPU信息,还可以打印内存,I/O等方面的信息,如下是比较有用的信息:
- pidstat -d 1:看哪些进程有读写。
- pidstat -r 1:看进程的page fault和内存使用。没有发生page fault的进程默认不会被打印出来,可以指定-p和进程号来打印查看内存。
- pidstat -t: 利用-t查看线程信息,可以快速查看线程和期相关线程的关系。
- pidstat -w:利用-w查看进程的context switch情况。输出:
- cswch/s: 每秒发生的voluntary context switch数目 (voluntary cs:当进程被block在获取不到的资源时,主动发生的context switch)
- nvcswch/s: 每秒发生的non voluntary context switch数目 (non vloluntary cs:进程执行一段时间用完了CPU分配的time slice,被强制从CPU上调度下来,这时发生的context switch)
上面示例中可以明确得看到是nc这个进程在消耗CPU 1 100%的CPU。因为测试系统里消耗CPU的进程比较少,所以一目了然,在生产系统中pidstat应该能输出更多正在消耗CPU的进程情况。
6. iostat -zx 1
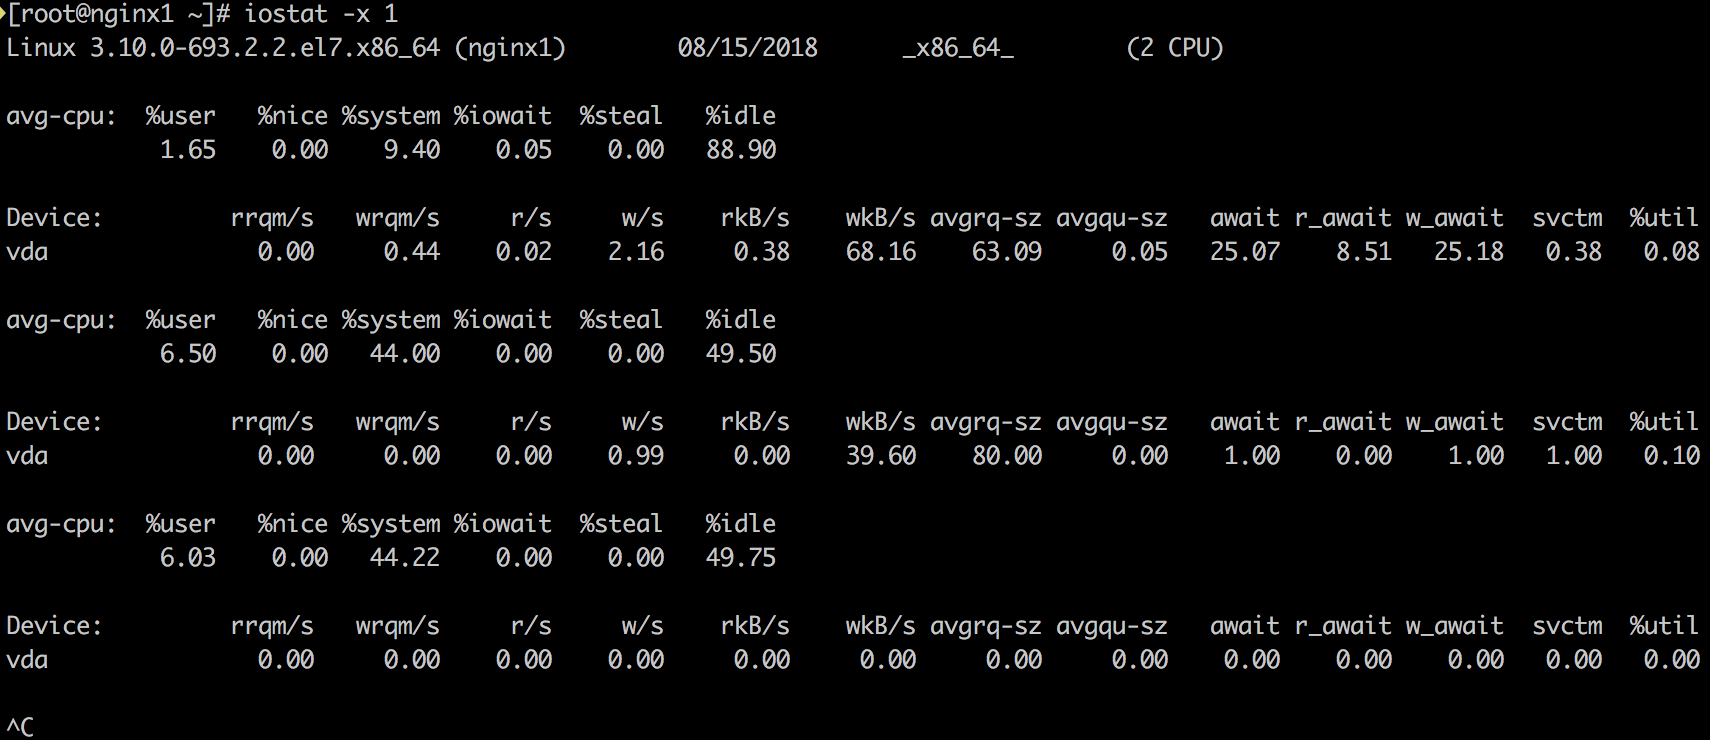
了解块设备(block device, 这里是disk)负载和性能的工具。主要看如下指标:
- r/s, w/s, rkB/s, wkB/s:每秒完成的读请求次数(read requests, after merges),每秒完成的写请求次数(write requests completed, after merges),每秒读取的千字节数,每秒写入的千字节数。这些指标可以看出disk的负载情况。一个性能问题可能仅仅是因为disk的负载过大。
- await:每个I/O平均所需的时间,单位为毫秒。await不仅包括硬盘设备处理I/O的时间,还包括了在kernel队列中等待的时间。要精确地知道块设备service一个I/O请求地时间,可供iostat读取地内核统计并没有体现,需要用如blktrace这样地跟踪工具来跟踪。对于blktrace来说,D2C的时间间隔代表硬件块设备地service time,Q2C代表整个I/O请求所消耗的时间,即iostat的await。
- avgqu-sz:队列里的平均I/O请求数量 (更恰当的理解应该是平均未完成的I/O请求数量)。如果该值大于1,则有饱和的趋势 (当然设备可以并发地处理请求,特别是一个front对多个backend disk的虚拟设备)。
- %util:设备在处理I/O的时间占总时间的百分比。表示该设备有I/O(即非空闲)的时间比率,不考虑I/O有多少,只考虑有没有。通常该指标达到60%即可能引起性能问题 (可以根据await指标进一步求证)。如果指标接近100%,通常就说明出现了饱和。
如果存储设备是一个对应多个后端磁盘的逻辑磁盘,那么100%使用率可能仅仅表示一些I/O在处理时间占比达到100%,其他后端磁盘不一定也到达了饱和。请注意磁盘I/O的性能问题并不一定会造成应用的问题,很多技术都是使用异步I/O操作,所以应用不一定会被block或者直接受到延迟的影响。
7. free -m
# free -m
total used free shared buff/cache available
Mem: 7822 129 214 0 7478 7371
Swap: 0 0 0
查看内存使用情况。倒数第二列:
- buffers: buffer cache,用于block device I/O。
- cached: page cache, 用于文件系统。
Linux用free memory来做cache, 当应用需要时,这些cache可以被回收。比如kswapd内核进程做页面回收时可能回收cache;另外手动写/proc/sys/vm/drop_caches也会导致cache回收。
上面示例中free的内存只有129M,大部分memory被cache占用。但是系统并没有问题。
8. sar -n DEV 1
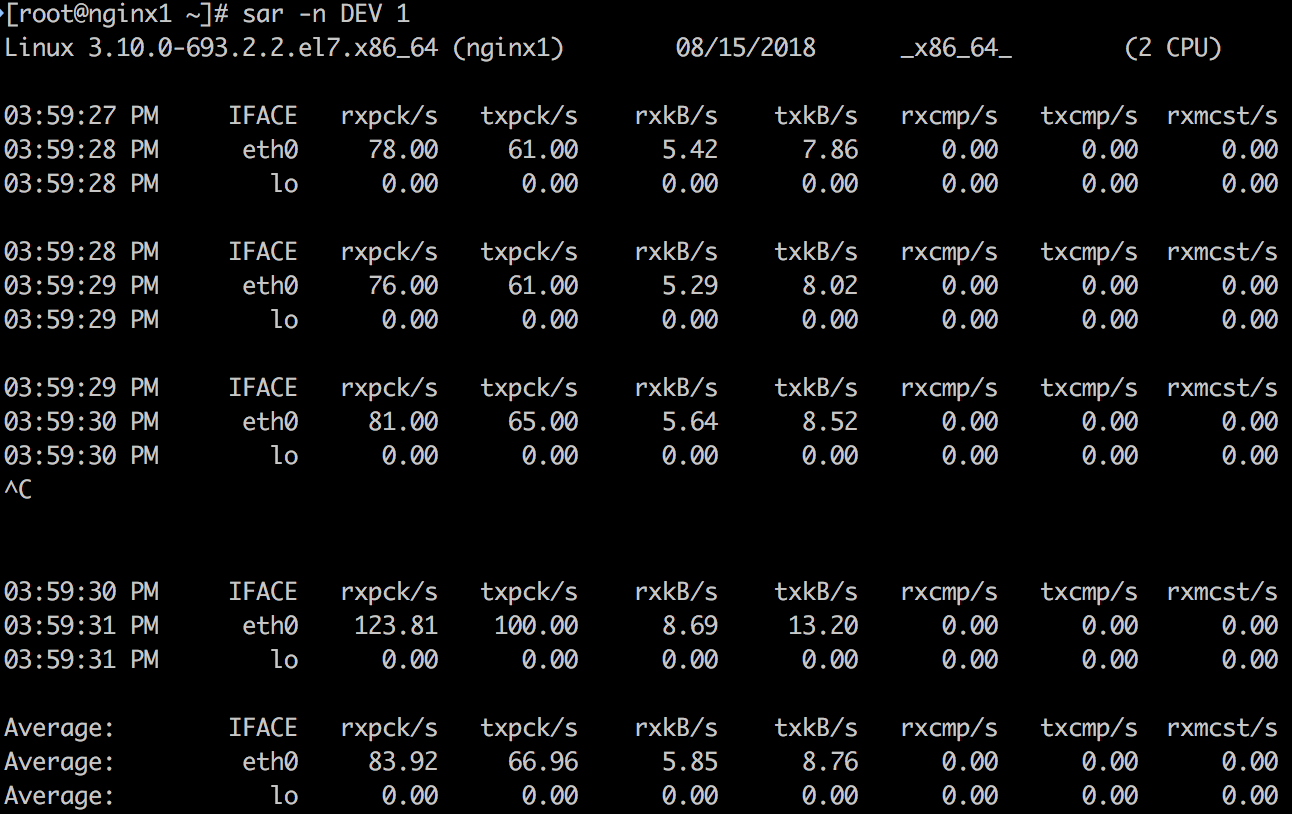
输出指标的含义如下:
- rxpck/s: Total number of packets received per second.
- txpck/s: Total number of packets transmitted per second.
- rxkB/s: Total number of kilobytes received per second.
- txkB/s: Total number of kilobytes transmitted per second.
- rxcmp/s: Number of compressed packets received per second (for cslip etc.).
- txcmp/s: Number of compressed packets transmitted per second.
- rxmcst/s: Number of multicast packets received per second.
- %ifutil: Utilization percentage of the network interface. For half-duplex interfaces, utilization is calculated using the sum of rxkB/s and txkB/s as a percentage of the interface speed.
- For full-duplex, this is the greater of rxkB/S or txkB/s.
这个工具可以查看网络接口的吞吐量,特别是上面蓝色高亮的rxkB/s和txkB/s,这是网络负载,也可以看是否达到了limit。
9. sar -n TCP,ETCP 1
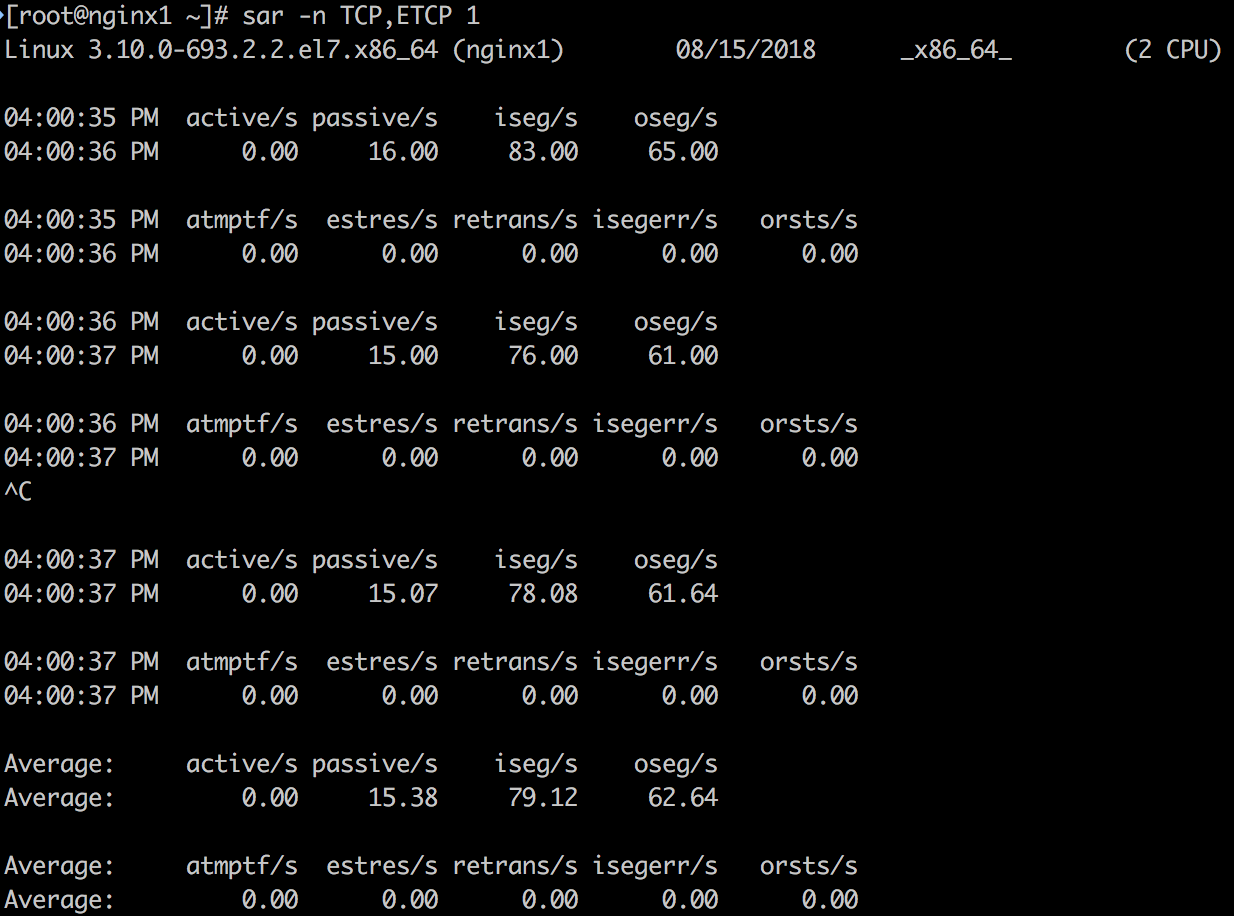
输出指标的含义如下:
- active/s: The number of times TCP connections have made a direct transition to the SYN-SENT state from the CLOSED state per second [tcpActiveOpens].
- passive/s: The number of times TCP connections have made a direct transition to the SYN-RCVD state from the LISTEN state per second [tcpPassiveOpens].
- iseg/s: The total number of segments received per second, including those received in error [tcpInSegs]. This count includes segments received on currently established connections.
- oseg/s: The total number of segments sent per second, including those on current connections but excluding those containing only retransmitted octets [tcpOutSegs].
- atmptf/s: The number of times per second TCP connections have made a direct transition to the CLOSED state from either the SYN-SENT state or the SYN-RCVD state, plus the number of times per second TCP connections have made a direct transition to the LISTEN state from the SYN-RCVD state [tcpAttemptFails].
- estres/s: The number of times per second TCP connections have made a direct transition to the CLOSED state from either the ESTABLISHED state or the CLOSE-WAIT state [tcpEstabResets].
- retrans/s: The total number of segments retransmitted per second - that is, the number of TCP segments transmitted containing one or more previously transmitted octets [tcpRetransSegs].
- isegerr/s: The total number of segments received in error (e.g., bad TCP checksums) per second [tcpInErrs].
- orsts/s: The number of TCP segments sent per second containing the RST flag [tcpOutRsts].
上述蓝色高亮的3个指标:active/s, passive/s和retrans/s是比较有代表性的指标。
- active/s和passive/s分别是本地发起的每秒新建TCP连接数和远程发起的TCP新建连接数。这两个指标可以粗略地判断服务器的负载。可以用active衡量出站发向,用passive衡量入站方向,但也不是完全准确(比如,考虑localhost到localhost的连接)。
- retrans是网络或者服务器发生问题的象征。有可能问题是网络不稳定,比如Internet网络问题,或者服务器过载丢包。
10. top
# top
Tasks:  79 total,   2 running,  77 sleeping,   0 stopped,   0 zombie
%Cpu(s):  6.0 us, 44.1 sy,  0.0 ni, 49.6 id,  0.0 wa,  0.0 hi,  0.3 si,  0.0 st
KiB Mem :  8010456 total,  7326348 free,   132296 used,   551812 buff/cache
KiB Swap:        0 total,        0 free,        0 used.  7625940 avail Mem

  PID USER      PR  NI    VIRT    RES    SHR S  %CPU %MEM     TIME+ COMMAND
 4617 root      20   0   44064   2076   1544 R 100.0  0.0  16:27.23 nc
13634 nginx     20   0  121192   3864   1208 S   0.3  0.0  17:59.85 nginx
    1 root      20   0  125372   3740   2428 S   0.0  0.0   6:11.53 systemd
    2 root      20   0       0      0      0 S   0.0  0.0   0:00.60 kthreadd
    3 root      20   0       0      0      0 S   0.0  0.0   0:17.92 ksoftirqd/0
    5 root       0 -20       0      0      0 S   0.0  0.0   0:00.00 kworker/0:0H
    7 root      rt   0       0      0      0 S   0.0  0.0   0:03.21 migration/0
    8 root      20   0       0      0      0 S   0.0  0.0   0:00.00 rcu_bh
    9 root      20   0       0      0      0 S   0.0  0.0  31:47.62 rcu_sched
   10 root      rt   0       0      0      0 S   0.0  0.0   0:10.00 watchdog/0
top是一个常用的命令,包括了多方面的指标。缺点是没有滚动输出(rolling output),不可复现问题发生时不容易保留信息。对于信息保留,用vmstat或者pidstat等能够提供滚动输出的工具会更好。
示例的问题?
在上面利用工具排查的过程中,我们可以在非常短的时间内快速得到如下结论:
- 2个CPU,nc这个进程消耗了CPU 1 100%的时间,并且时间消耗在system内核态。其他进程基本没有在消耗CPU。
- 内存free比较少,大部分在cache中 (并不是问题)。
- Disk I/O非常低,平均读写请求小于1个。
- 收到报文在个位数KB/s级别,每秒有15个被动建立的TCP连接,没有明显异常。
整个排查过程把系统的问题定位到了进程级别,并且能排除一些可能性 (Disk I/O和内存)。接下来就是进一步到进程级别的排查,不属于本文的覆盖范围,有时间再进一步演示。
参考
来源: https://www.cnblogs.com/wipan/p/9461005.html
http://yyk.familydoctor.com.cn/21206/content_948738.html http://yyk.familydoctor.com.cn/21206/content_948728.html http://yyk.familydoctor.com.cn/21206/content_947943.html http://yyk.familydoctor.com.cn/21206/content_947944.html