摘要: 问题来源 问题来源于cnode社区:node启动占用内存的问题。 自己本地跑了一下,乖乖不得了,启动一个 node,什么都不做。结果是这样子的:果然900+M。 我的电脑信息: $cat /proc/version Linux version 4.
问题来源
问题来源于cnode社区:node启动占用内存的问题。
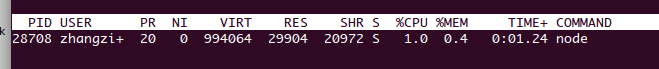
自己本地跑了一下,乖乖不得了,启动一个 node,什么都不做。结果是这样子的:果然900+M。
我的电脑信息:
$cat /proc/version
Linux version 4.13.0-38-generic (buildd@lgw01-amd64-027) (gcc version 5.4.0 20160609 (Ubuntu 5.4.0-6ubuntu1~16.04.9)) #43~16.04.1-Ubuntu SMP Wed Mar 14 17:48:43 UTC 2018
$cat /proc/cpuinfo | grep processor
processor    : 0
processor    : 1
processor    : 2
processor    : 3
我们知道,进程真正从OS拿到的内存是RSS,一般意义上讲,进程占了多少内存就是这个RSS。因此,cnode 社区的这个标题有点欠妥。
那么我就求证一下 node 到底在哪里申请了这么多虚拟内存。
求证过程
pmap 查看虚拟内存使用情况
下面命令输出中把一些100KB以下的信息省略,有兴趣的同学可以自己查看。
$ pmap -d 28708
28708:   ./node
Address           Kbytes Mode  Offset           Device    Mapping
0000000000400000   28540 r-x-- 0000000000000000 008:00005 node
00000000021df000       4 r---- 0000000001bdf000 008:00005 node
00000000021e0000     104 rw--- 0000000001be0000 008:00005 node
00000000021fa000    2168 rw--- 0000000000000000 000:00000   [ anon ]
0000000003bd6000    1352 rw--- 0000000000000000 000:00000   [ anon ]
0000031078d80000     512 rw--- 0000000000000000 000:00000   [ anon ]
000003cf96a00000     512 rw--- 0000000000000000 000:00000   [ anon ]
00000439e7900000     512 rw--- 0000000000000000 000:00000   [ anon ]
0000083024e00000     512 ----- 0000000000000000 000:00000   [ anon ]
000008c587300000     512 rw--- 0000000000000000 000:00000   [ anon ]
00000b1f3fb00000     512 ----- 0000000000000000 000:00000   [ anon ]
00000f247cf80000     512 rw--- 0000000000000000 000:00000   [ anon ]
0000169de244f000     196 ----- 0000000000000000 000:00000   [ anon ]
0000169de2485000     492 ----- 0000000000000000 000:00000   [ anon ]
0000169de2505000     492 ----- 0000000000000000 000:00000   [ anon ]
0000169de2585000     492 ----- 0000000000000000 000:00000   [ anon ]
0000169de2604000     492 rwx-- 0000000000000000 000:00000   [ anon ]
0000169de2684000     492 rwx-- 0000000000000000 000:00000   [ anon ]
0000169de2704000     492 rwx-- 0000000000000000 000:00000   [ anon ]
0000169de27ff000  520512 ----- 0000000000000000 000:00000   [ anon ]
000017db76f80000     316 rw--- 0000000000000000 000:00000   [ anon ]
0000219337b00000     512 rw--- 0000000000000000 000:00000   [ anon ]
000025cdf0280000     512 rw--- 0000000000000000 000:00000   [ anon ]
000025e610580000     512 ----- 0000000000000000 000:00000   [ anon ]
000026bff1500000     512 rw--- 0000000000000000 000:00000   [ anon ]
000028eaed980000     512 ----- 0000000000000000 000:00000   [ anon ]
0000309c9b900000     512 rw--- 0000000000000000 000:00000   [ anon ]
000031a7c5980000     512 ----- 0000000000000000 000:00000   [ anon ]
0000389d07380000     512 rw--- 0000000000000000 000:00000   [ anon ]
00003a0dee480000     512 rw--- 0000000000000000 000:00000   [ anon ]
00007f1630000000     132 rw--- 0000000000000000 000:00000   [ anon ]
00007f1630021000   65404 ----- 0000000000000000 000:00000   [ anon ]
00007f1634000000     132 rw--- 0000000000000000 000:00000   [ anon ]
00007f1634021000   65404 ----- 0000000000000000 000:00000   [ anon ]
00007f1638ffb000    8192 rw--- 0000000000000000 000:00000   [ anon ]
00007f16397fc000    8192 rw--- 0000000000000000 000:00000   [ anon ]
00007f1639ffd000    8192 rw--- 0000000000000000 000:00000   [ anon ]
00007f163a7fe000    8192 rw--- 0000000000000000 000:00000   [ anon ]
00007f163afff000    8192 rw--- 0000000000000000 000:00000   [ anon ]
00007f163b800000    8192 rw--- 0000000000000000 000:00000   [ anon ]
00007f163c000000     132 rw--- 0000000000000000 000:00000   [ anon ]
00007f163c021000   65404 ----- 0000000000000000 000:00000   [ anon ]
00007f1640000000     132 rw--- 0000000000000000 000:00000   [ anon ]
00007f1640021000   65404 ----- 0000000000000000 000:00000   [ anon ]
00007f1644000000     132 rw--- 0000000000000000 000:00000   [ anon ]
00007f1644021000   65404 ----- 0000000000000000 000:00000   [ anon ]
00007f1648713000    8192 rw--- 0000000000000000 000:00000   [ anon ]
00007f1648f14000    8192 rw--- 0000000000000000 000:00000   [ anon ]
00007f1649715000    8192 rw--- 0000000000000000 000:00000   [ anon ]
00007f1649f16000    8192 rw--- 0000000000000000 000:00000   [ anon ]
00007f164a716000    1792 r-x-- 0000000000000000 008:00005 libc-2.23.so
00007f164a8d6000    2048 ----- 00000000001c0000 008:00005 libc-2.23.so
00007f164aaf8000    2044 ----- 0000000000018000 008:00005 libpthread-2.23.so
00007f164ad13000    2044 ----- 0000000000016000 008:00005 libgcc_s.so.1
00007f164af13000    1056 r-x-- 0000000000000000 008:00005 libm-2.23.so
00007f164b01b000    2044 ----- 0000000000108000 008:00005 libm-2.23.so
00007f164b21c000    1480 r-x-- 0000000000000000 008:00005 libstdc++.so.6.0.21
00007f164b38e000    2048 ----- 0000000000172000 008:00005 libstdc++.so.6.0.21
00007f164b5a5000    2044 ----- 0000000000007000 008:00005 librt-2.23.so
00007f164b7a9000    2044 ----- 0000000000003000 008:00005 libdl-2.23.so
00007f164b9aa000     152 r-x-- 0000000000000000 008:00005 ld-2.23.so
00007ffc8810d000     136 rw--- 0000000000000000 000:00000   [ stack ]
mapped: 994068K    writeable/private: 94540K    shared: 0K
最后一行的信息:
mapped表示该进程映射的虚拟地址空间大小,也就是该进程预先分配的虚拟内存大小,即ps出的vszwriteable/private表示进程所占用的私有地址空间大小,也就是该进程实际使用的内存大小shared表示进程和其他进程共享的内存大小
命令输出信息具体含义,跟 liunx 下内存管理相关,那个话题实在太大,这里只关注虚拟内存哪里来的这个问题。

上面的输出结果中,大头是下面这几列。一共 500+M + 64M * 5,大约 800+M。
0000169de27ff000  520512 ----- 0000000000000000 000:00000   [ anon ]
00007f1630021000   65404 ----- 0000000000000000 000:00000   [ anon ]
00007f1634021000   65404 ----- 0000000000000000 000:00000   [ anon ]
00007f163c021000   65404 ----- 0000000000000000 000:00000   [ anon ]
00007f1640021000   65404 ----- 0000000000000000 000:00000   [ anon ]
00007f1644021000   65404 ----- 0000000000000000 000:00000   [ anon ]
具体占用情况
作为一个程序员,基本一看就知道分两类,512M 和 64M。
下面这段话来自Java程序在Linux上运行虚拟内存耗用很大
我们知道Linux下glibc的内存管理机制用了一个很奇妙的东西,叫arena。在glibc分配内存的时候,大内存从从中央分配区分配,小内存则在线程创建时,从缓存区分配。为了解决分配内存的性能的问题,就引入了这个叫做arena的memory pool。而恰好,在64bit系统下面,它的缺省配置为64M。
Red Hat Enterprise Linux 6 features version 2.11 of glibc, providing many features and enhancements, including… An enhanced dynamic memory allocation (malloc) behaviour enabling higher scalability across many sockets and cores.This is achieved by assigning threads their own memory pools and by avoiding locking in some situations. The amount of additional memory used for the memory pools (if any) can be controlled using the environment variables MALLOC_ARENA_TEST and MALLOC_ARENA_MAX. MALLOC_ARENA_TEST specifies that a test for the number of cores is performed once the number of memory pools reaches this value. MALLOC_ARENA_MAX sets the maximum number of memory pools used, regardless of the number of cores.
验证一下:
$export MALLOC_ARENA_MAX=1
$./node
# 在另外一个窗口
$pmap -d 28567 |grep mapped
mapped: 666420K    writeable/private: 96472K    shared: 0K
64M的一块也没了。(994068 - 666420 = 327648)。
好了,就剩下最大的512M的问题了。
这块应该是 node 本身申请的了。在 node v8.x-staging 的代码上找了一下虚拟内存相关的代码。发现了这个VirtualMemory
按说这里只看代码就能对照调用链可以找到申请的地方。不过还是用了偷懒的办法:编一个debug版本的Node.js,然后利用gdb来找到backtrace。
断点设置在 v8::base::VirtualMemory::VirtualMemory(unsigned long, unsigned long, void*)
$./configure --debug
$make -j 4
make -C out BUILDTYPE=Release V=1
make -C out BUILDTYPE=Debug V=1
...
# 喝杯茶,出去转一圈回来就能编译好了
...

$ gdb out/Debug/node
GNU gdb (Ubuntu 7.11.1-0ubuntu1~16.5) 7.11.1
Copyright (C) 2016 Free Software Foundation, Inc.
License GPLv3+: GNU GPL version 3 or later <http://gnu.org/licenses/gpl.html>
This is free software: you are free to change and redistribute it.
There is NO WARRANTY, to the extent permitted by law.  Type "show copying"
and "show warranty" for details.
This GDB was configured as "x86_64-linux-gnu".
Type "show configuration" for configuration details.
For bug reporting instructions, please see:
<http://www.gnu.org/software/gdb/bugs/>.
Find the GDB manual and other documentation resources online at:
<http://www.gnu.org/software/gdb/documentation/>.
For help, type "help".
Type "apropos word" to search for commands related to "word"...
Reading symbols from out/Debug/node...done.
(gdb) break v8::base::VirtualMemory::VirtualMemory(unsigned long, unsigned long, void*)
Breakpoint 1 at 0x26b6b90: file ../deps/v8/src/base/platform/platform-linux.cc, line 203.
(gdb) run
Starting program: /path/to/your/node/out/Debug/node
[Thread debugging using libthread_db enabled]
Using host libthread_db library "/lib/x86_64-linux-gnu/libthread_db.so.1".
[New Thread 0x7ffff6b42700 (LWP 23574)]
[New Thread 0x7ffff6341700 (LWP 23575)]
[New Thread 0x7ffff5b40700 (LWP 23576)]
[New Thread 0x7ffff533f700 (LWP 23577)]

Thread 1 "node" hit Breakpoint 1, v8::base::VirtualMemory::VirtualMemory (this=0x7fffffffc780, size=536870912, alignment=4096, hint=0x137a187d000)
    at ../deps/v8/src/base/platform/platform-linux.cc:203
203        : address_(NULL), size_(0) {
(gdb) bt
#0  v8::base::VirtualMemory::VirtualMemory (this=0x7fffffffc780, size=536870912, alignment=4096, hint=0x137a187d000)
    at ../deps/v8/src/base/platform/platform-linux.cc:203
#1  0x000000000178cf0f in v8::internal::AlignedAllocVirtualMemory (size=536870912, alignment=4096, hint=0x137a187d000, result=0x7fffffffc810)
    at ../deps/v8/src/allocation.cc:117
#2  0x0000000001ea39e8 in v8::internal::CodeRange::SetUp (this=0x3ca6f20, requested=536870912) at ../deps/v8/src/heap/spaces.cc:122
#3  0x0000000001ea4649 in v8::internal::MemoryAllocator::SetUp (this=0x3ca7a00, capacity=1501560832, code_range_size=0)
    at ../deps/v8/src/heap/spaces.cc:304
#4  0x0000000001e22c46 in v8::internal::Heap::SetUp (this=0x3c65650) at ../deps/v8/src/heap/heap.cc:5922
#5  0x0000000001f5a8a7 in v8::internal::Isolate::Init (this=0x3c65630, des=0x7fffffffcc40) at ../deps/v8/src/isolate.cc:2786
#6  0x0000000002265697 in v8::internal::Snapshot::Initialize (isolate=0x3c65630) at ../deps/v8/src/snapshot/snapshot-common.cc:46
#7  0x00000000017d147d in v8::IsolateNewImpl (isolate=0x3c65630, params=...) at ../deps/v8/src/api.cc:8633
#8  0x00000000017d1284 in v8::Isolate::New (params=...) at ../deps/v8/src/api.cc:8580
#9  0x0000000002415900 in node::Start (event_loop=0x3a45fe0 <default_loop_struct>, argc=1, argv=0x3c63ea0, exec_argc=0, exec_argv=0x3c63f80)
    at ../src/node.cc:4856
#10 0x000000000240cba5 in node::Start (argc=1, argv=0x3c63ea0) at ../src/node.cc:4945
#11 0x00000000024843cb in main (argc=1, argv=0x7fffffffd8b8) at ../src/node_main.cc:106
(gdb)
512M找到了:
Thread 1 "node" hit Breakpoint 1, v8::base::VirtualMemory::VirtualMemory (this=0x7fffffffc780, size=536870912, alignment=4096, hint=0x137a187d000)顺着这条链路,我们可以看到有这么一段关于CodeRange deps/v8/src/heap/spaces.h的描述:
// All heap objects containing executable code (code objects) must be allocated
// from a 2 GB range of memory, so that they can call each other using 32-bit
// displacements.  This happens automatically on 32-bit platforms, where 32-bit
// displacements cover the entire 4GB virtual address space.  On 64-bit
// platforms, we support this using the CodeRange object, which reserves and
// manages a range of virtual memory.
在 CodeRange::SetUp(size_t requested) 中的这段代码
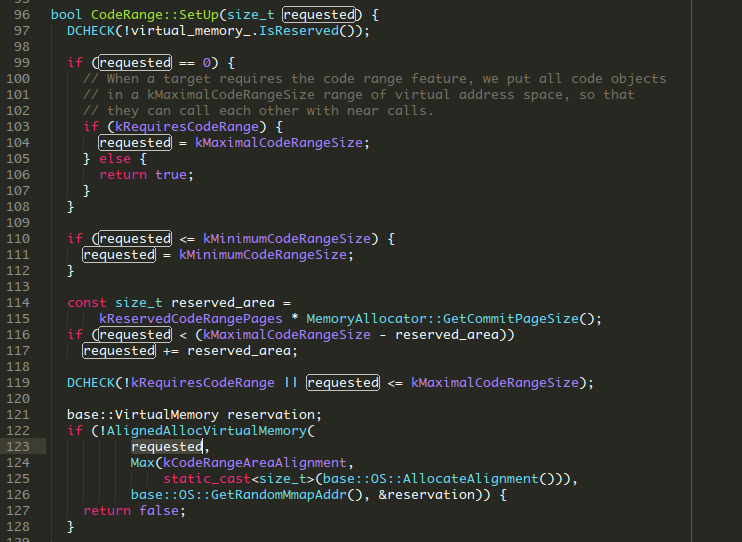
-
非常清晰的描述:
// When a target requires the code range feature, we put all code objects
// in a kMaximalCodeRangeSize range of virtual address space, so that
// they can call each other with near calls.
kMaximalCodeRangeSize 512M的定义。
问题结论:
900+M的虚拟内存,其中512M是 v8 为代码申请。64M * N(根据OS设置)是glibc的一种内存分配机制产生。其它剩余小块没有深究,感兴趣的同学可以类似思路去探索。