一.MAT简介
MAT是分析工具,安装略。
二.配置
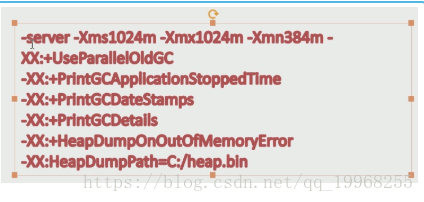
出现oom导出dump文件,分析报告
三.堆分析
1.OOM(内存溢出)原因:
StackOverFlow 栈 ,Stack属于栈的区域,属于每条线程私有的
HeapOutOfMemory 堆
ConstantOutOfMemory 常量池
DirectMemoryOutOfmemory 本地内存

2.堆溢出
public static void main(String args[]){
ArrayList<byte[]> list=new ArrayList<byte[]>();
for(int i=0;i<1024;i++){
list.add(new byte[1024*1024]);
}
}
占用大量堆空间,直接溢出,解决方法:增大堆空间,及时释放内存
生成大量的类
public static void main(String[] args) {
for(int i=0;i<100000;i++){
CglibBean bean = new CglibBean("geym.jvm.ch3.perm.bean"+i,new HashMap());
}
}
Caused by: java.lang.OutOfMemoryError: PermGen space
[Full GC[Tenured: 2523K->2523K(10944K), 0.0125610 secs] 2523K->2523K(15936K),
[Perm : 4095K->4095K(4096K)], 0.0125868 secs] [Times: user=0.02 sys=0.00, real=0.01 secs]
Heap
def new generation total 4992K, used 89K [0x28280000, 0x287e0000, 0x2d7d0000)
eden space 4480K, 2% used [0x28280000, 0x282966d0, 0x286e0000)
from space 512K, 0% used [0x286e0000, 0x286e0000, 0x28760000)
to space 512K, 0% used [0x28760000, 0x28760000, 0x287e0000)
tenured generation total 10944K, used 2523K [0x2d7d0000, 0x2e280000, 0x38280000)
the space 10944K, 23% used [0x2d7d0000, 0x2da46cf0, 0x2da46e00, 0x2e280000)
compacting perm gen total 4096K, used 4095K [0x38280000, 0x38680000, 0x38680000)
the space 4096K, 99% used [0x38280000, 0x3867fff0, 0x38680000, 0x38680000)
ro space 10240K, 44% used [0x38680000, 0x38af73f0, 0x38af7400, 0x39080000)
rw space 12288K, 52% used [0x39080000, 0x396cdd28, 0x396cde00, 0x39c80000)
解决方法:
增大Perm区
允许Class回收
3.Java栈溢出
在创建线程时候,需要为线程分配栈空间,这个栈空间是向操作系统请求的,如果操作系统无法给出足够的空间,就会抛出OOM
解决方法:
减少堆内存
减少线程栈大小
4.直接内存溢出
直接内存溢出
ByteBuffer.allocateDirect()无法从操作系统获得足够的空间
解决方法:
减少堆内存
有意触发GC
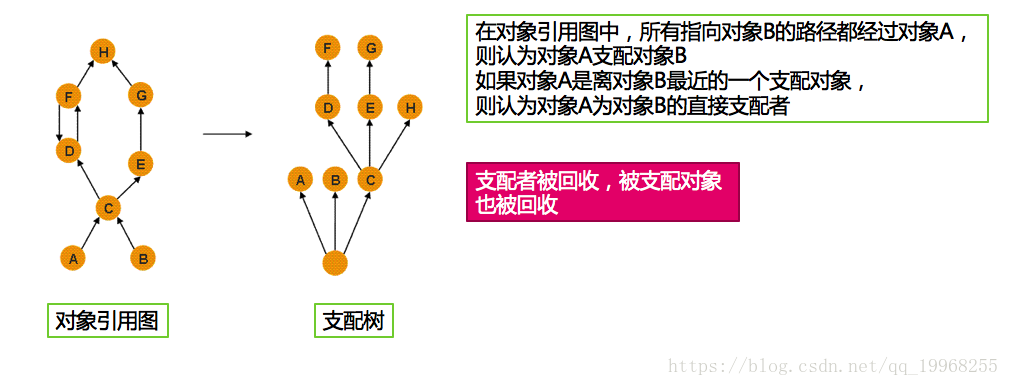
四.支配树
五.浅堆
1.一个对象结构所占用的内存大小
2.对象大小按照8字节对齐
3.浅堆大小和对象的内容无关,只和对象的结构有关
六.深堆
1.一个对象被GC回收后,可以真实释放的内存大小
2.只能通过对象访问到的(直接或者间接)所有对象浅堆之和(支配树)