今天可算是学会调试了,DEV-C++5.1.2居然可以调试了,方法如下:
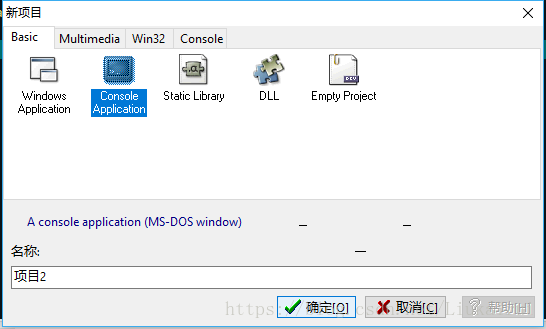
Step1 新建一个项目(文件——》新建——》项目,选择如图),注意cpp文件无法调试
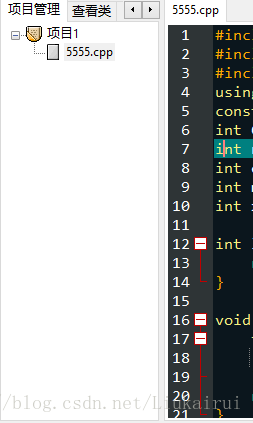
Step2 删除自带的main.cpp加入自己的cpp文件
Step3 打开项目——》项目属性———》编译器——》连接器——》产生调试信息 改为on
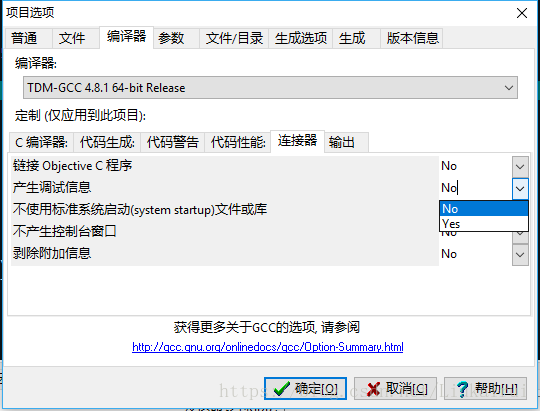
Step4 关闭优化(即关闭O2,O3)
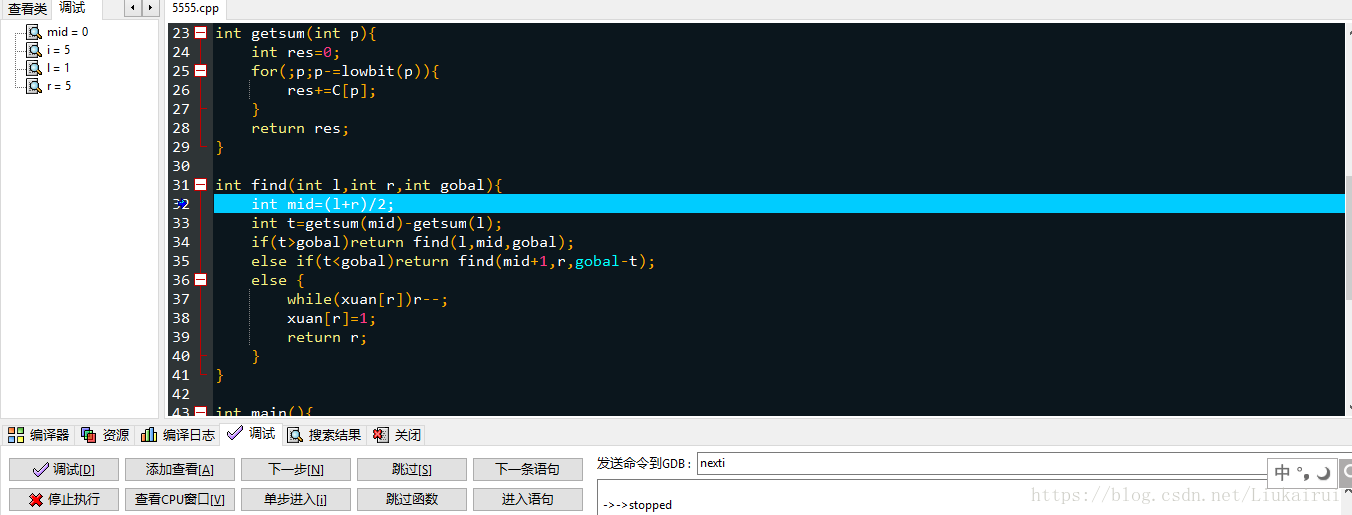
Step5 点开调试,断点在行号那里点一下就加上了,变量监视就是添加查看,其他的自选,最后点调试即可!蓝色是单步的时候当前语句
给一个原版说明:
How do I debug using Dev-C++?
First, make sure you are using a project.
Then go to Project Options - Compiler - Linker and set Generate debugging information to “yes”, and make sure you are not using any optimization options (they’re not good for debug mode). Also check the Parameters tab, make sure you don’t have any optimization options (like -O2 or -O3, but -O0 is ok because it means no optimization) or strip option (-s).
After that, do a full rebuild (Ctrl-F11), then set breakpoint(s) where you want the debugger to stop (otherwise it will just run the program). To set a breakpoint on a line, just click on the gutter (the gray band on the left), or press Ctrl-F5.
Now you are ready to launch the debugger, by pressing F8 or clicking the debug button. If everything goes well, the program will start, and then stop at the first breakpoint. Then you can step through the code, entering function calls, by pressing Shift-F7 or the “step into” button, or stepping over the function calls, by pressing F7 or the “next step” button. You can press Ctrl-F7 or the “continue” button to continue execution till the next breakpoint. At any time, you can add or remove breakpoints.
When the program stopped at a breakpoint and you are stepping through the code, you can display the values of various variables in your program by putting your mouse over them, or you can display variables and expressions by pressing F4 or the “add watch” button and typing the expression.
For more information refer to the help included with Dev-C++.