一、docker-compose安装ES7.14.0和kibana7.14.0
1、下载镜像
1.1、ES镜像
docker pull elasticsearch:7.14.0

1.2、kibana镜像
docker pull kibana:7.14.0

2、docker-compose安装ES和kibana
2.1、创建配置文件目录和文件
#创建目录
mkdir -p /home/es-kibana/config
mkdir -p /home/es-kibana/data
mkdir -p /home/es-kibana/plugins
#给挂载目录授权
chmod 777 -R /home/es-kibana/config
chmod 777 /home/es-kibana/es-data/data
chmod 777 /home/es-kibana/es-data/logs
chmod 777 /home/es-kibana/es-data/plugins
2.2、ES配置文件
1、elasticesearch.yml
cluster.name: "docker-cluster"
network.host: 0.0.0.0discovery.zen.minimum_master_nodes: 1
discovery.type: single-nodexpack.security.enabled: true #此项开启账号密码
2、jvm.options
## JVM configuration

################################################################
## IMPORTANT: JVM heap size
################################################################
##
## You should always set the min and max JVM heap
## size to the same value. For example, to set
## the heap to 4 GB, set:
##
## -Xms4g
## -Xmx4g
##
## See https://www.elastic.co/guide/en/elasticsearch/reference/current/heap-size.html
## for more information
##
################################################################

# Xms represents the initial size of total heap space
# Xmx represents the maximum size of total heap space

-Xms1g
-Xmx1g
-XX:+IgnoreUnrecognizedVMOptions
################################################################
## Expert settings
################################################################
##
## All settings below this section are considered
## expert settings. Don't tamper with them unless
## you understand what you are doing
##
################################################################

## GC configuration
-XX:+UseConcMarkSweepGC
-XX:CMSInitiatingOccupancyFraction=75
-XX:+UseCMSInitiatingOccupancyOnly

## G1GC Configuration
# NOTE: G1GC is only supported on JDK version 10 or later.
# To use G1GC uncomment the lines below.
# 10-:-XX:-UseConcMarkSweepGC
# 10-:-XX:-UseCMSInitiatingOccupancyOnly
# 10-:-XX:+UseG1GC
# 10-:-XX:InitiatingHeapOccupancyPercent=75

## optimizations

# pre-touch memory pages used by the JVM during initialization
-XX:+AlwaysPreTouch

## basic

# explicitly set the stack size
-Xss1m

# set to headless, just in case
-Djava.awt.headless=true

# ensure UTF-8 encoding by default (e.g. filenames)
-Dfile.encoding=GBK

# use our provided JNA always versus the system one
-Djna.nosys=true

# turn off a JDK optimization that throws away stack traces for common
# exceptions because stack traces are important for debugging
-XX:-OmitStackTraceInFastThrow

# flags to configure Netty
-Dio.netty.noUnsafe=true
-Dio.netty.noKeySetOptimization=true
-Dio.netty.recycler.maxCapacityPerThread=0

# log4j 2
-Dlog4j.shutdownHookEnabled=false
-Dlog4j2.disable.jmx=true

-Djava.io.tmpdir=${ES_TMPDIR}

## heap dumps

# generate a heap dump when an allocation from the Java heap fails
# heap dumps are created in the working directory of the JVM
-XX:+HeapDumpOnOutOfMemoryError

# specify an alternative path for heap dumps; ensure the directory exists and
# has sufficient space
-XX:HeapDumpPath=data

# specify an alternative path for JVM fatal error logs
-XX:ErrorFile=logs/hs_err_pid%p.log

## JDK 8 GC logging

8:-XX:+PrintGCDetails
8:-XX:+PrintGCDateStamps
8:-XX:+PrintTenuringDistribution
8:-XX:+PrintGCApplicationStoppedTime
8:-Xloggc:logs/gc.log
8:-XX:+UseGCLogFileRotation
8:-XX:NumberOfGCLogFiles=32
8:-XX:GCLogFileSize=64m

# JDK 9+ GC logging
9-:-Xlog:gc*,gc+age=trace,safepoint:file=logs/gc.log:utctime,pid,tags:filecount=32,filesize=64m
# due to internationalization enhancements in JDK 9 Elasticsearch need to set the provider to COMPAT otherwise
# time/date parsing will break in an incompatible way for some date patterns and locals
9-:-Djava.locale.providers=COMPAT

# temporary workaround for C2 bug with JDK 10 on hardware with AVX-512
10-:-XX:UseAVX=2
主要是这3个配置项

2.3、kibana配置
i18n.locale: zh-CN
server.host: "0.0.0.0"
server.shutdownTimeout: "5s"
elasticsearch.hosts: [ "http://10.1.1.197:9200" ]
monitoring.ui.container.elasticsearch.enabled: true
elasticsearch.username: "elastic"
elasticsearch.password: "xxx"
2.4、#创建docker-compose.yml文件(重要)
version: '3'

services:
    elasticsearch:
        image: elasticsearch:7.14.0
        container_name: es7-14
        restart: unless-stopped
        volumes:
          - ./es-data/data:/usr/share/elasticsearch/data
          - ./es-data/logs:/usr/share/elasticsearch/logs
          # 挂载分词器的目录
          #- ./es-data/plugins:/usr/share/elasticsearch/plugins
          - ./config/jvm.options:/usr/share/elasticsearch/config/jvm.options
          - ./config/elasticsearch.yml:/usr/share/elasticsearch/config/elasticsearch.yml
        ports:
          - "9100:9100"
          - "9200:9200"

        networks:
          - es
    kibana:
        image: kibana:7.14.0
        container_name: kibana7-14
        ports:
          - "5601:5601"
        volumes:
          - ./config/kibana.yml:/usr/share/kibana/config/kibana.yml
        depends_on:
          - elasticsearch
        networks:
          - es

networks:
    es:
        driver: bridge
2.5、#自我检测自己写的有没有语法上的问题
docker-compose config -q
2.6、#启动和停止
docker-compose up -d
docker-compose down
重启
docker-compose restart 容器id
3、ES设置账号密码
3.1、检查elasticesearch.yml已配置
xpack.security.enabled: true #此项开启账号密码(只配置这项就可以了)
3.2、设置用户名和密码的命令
参考:【精选】ElasticSearch7.14设置内置用户,使用用户名密码访问
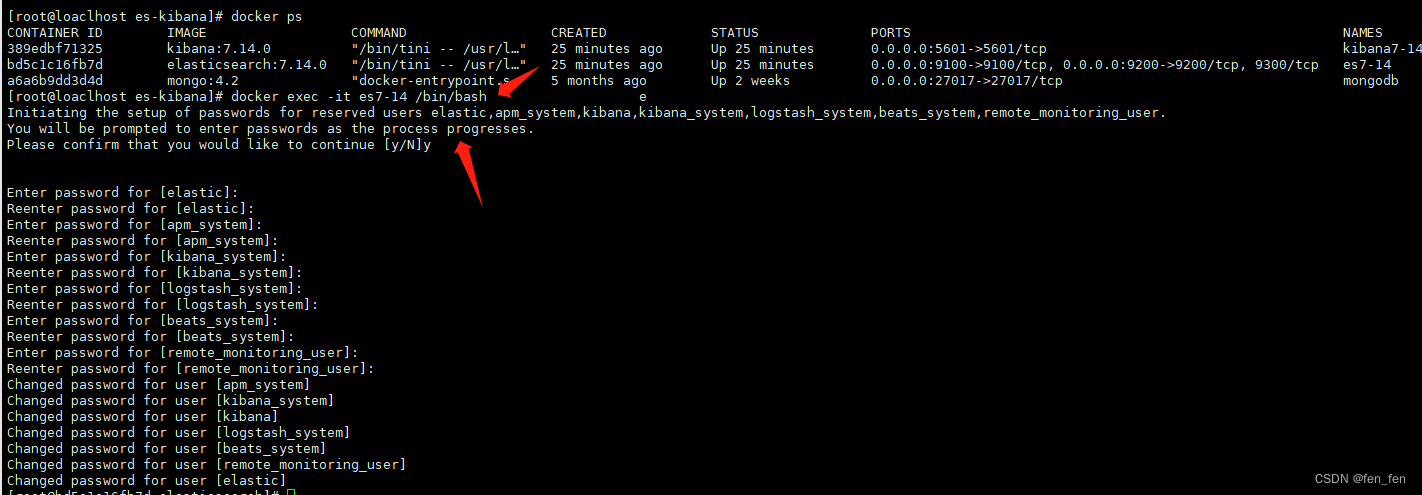
这里需要为4个用户分别设置密码,elastic, kibana, logstash_system,beats_system。(interactive 手动设置, auto 自动生成密码 )
bin/elasticsearch-setup-passwords interactive
#进入es容器操作步骤
$docker exec -it es7-14 /bin/bash
#手动创建密码
$bin/elasticsearch-setup-passwords interactive
3、访问ES和kibana
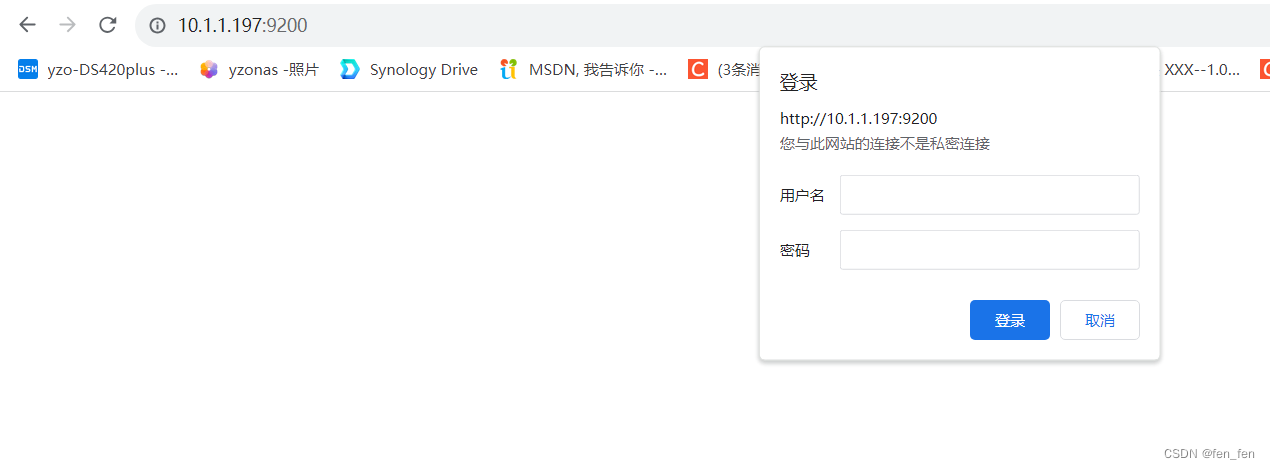
3.1、访问ES
需要输入账号密码即可登录
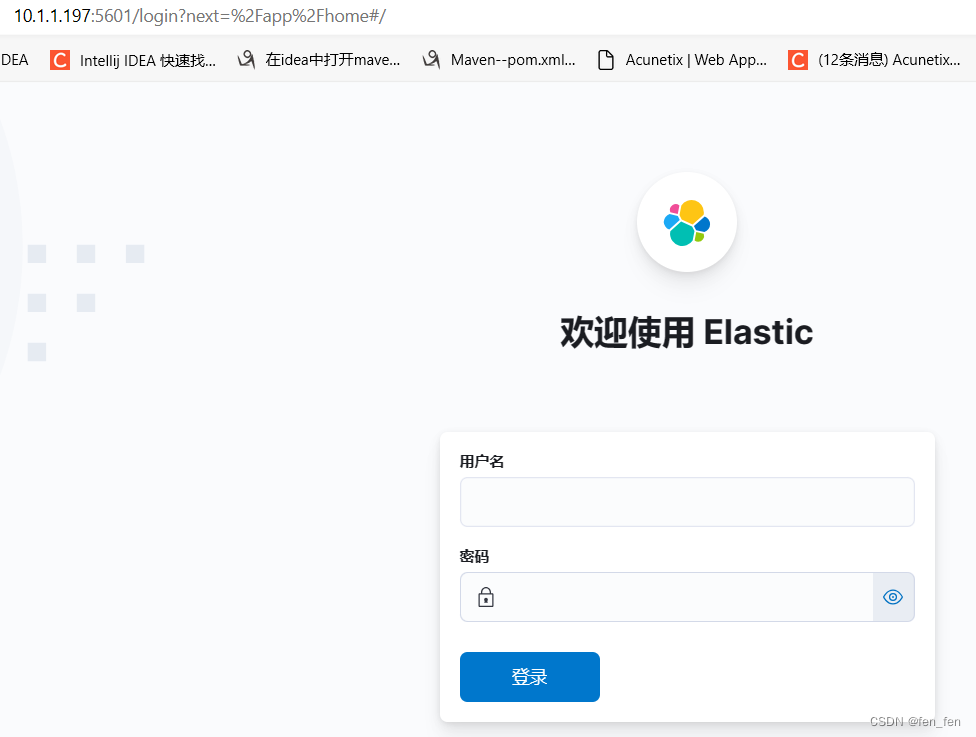
3.2、访问kibana
备注1:设置密码的配置文件,配置这个就可以了
xpack.security.enabled: true #此项开启账号密码(只配置这项就可以了)
然后进入容器里配置密码bin/elasticsearch-setup-passwords interactive就可用了。
备注2:docker-compose down后可能密码没了,所以最好是docker stop 容器id和docker start 容器id