说明:KEDA有啥用,相对HPA有啥优势。HPA针对于cpu,内存来进行弹性伸缩,有点不太精确。KEDA可以接入prometheus,根据prometheus的数据指标进行弹性伸缩,相比更加的精准实用。
- 安装k8s环境
- 部署prometheus
创建ns:
部署说明:下载的镜像地址有可能下载很慢,可以去相关网站拉取然后修改镜像地址。或者实用代理网络下载。
kubectl create ns keda-demo
#cat  prometheus.yaml
apiVersion: rbac.authorization.k8s.io/v1
kind: ClusterRole
metadata:
  name: prometheus
rules:
  - apiGroups: [""]
    resources:
      - services
    verbs: ["get", "list", "watch"]
  - nonResourceURLs: ["/metrics"]
    verbs: ["get"]
---
apiVersion: v1
kind: ServiceAccount
metadata:
  name: keda-demo
---
apiVersion: rbac.authorization.k8s.io/v1
kind: ClusterRoleBinding
metadata:
  name: prometheus
roleRef:
  apiGroup: rbac.authorization.k8s.io
  kind: ClusterRole
  name: prometheus
subjects:
  - kind: ServiceAccount
    name: keda-demo
    namespace: keda-demo
---
apiVersion: v1
kind: ConfigMap
metadata:
  name: prom-conf
  labels:
    name: prom-conf
data:
  prometheus.yml: |-
    global:
      scrape_interval: 5s
      evaluation_interval: 5s
    scrape_configs:
      - job_name: 'go-prom-job'
        kubernetes_sd_configs:
        - role: service
        relabel_configs:
        - source_labels: [__meta_kubernetes_service_label_run]
          regex: go-prom-app-service
          action: keep
---
apiVersion: apps/v1
kind: Deployment
metadata:
  name: prometheus-deployment
spec:
  replicas: 1
  selector:
    matchLabels:
      app: prometheus-server
  template:
    metadata:
      labels:
        app: prometheus-server
    spec:
      serviceAccountName: keda-demo
      containers:
        - name: prometheus
          image: prom/prometheus
          args:
            - "--config.file=/etc/prometheus/prometheus.yml"
            - "--storage.tsdb.path=/prometheus/"
          ports:
            - containerPort: 9090
          volumeMounts:
            - name: prometheus-config-volume
              mountPath: /etc/prometheus/
            - name: prometheus-storage-volume
              mountPath: /prometheus/
      volumes:
        - name: prometheus-config-volume
          configMap:
            defaultMode: 420
            name: prom-conf
        - name: prometheus-storage-volume
          emptyDir: {

    }
---
apiVersion: v1
kind: Service
metadata:
  name: prometheus-service
spec:
  type: NodePort
  ports:
    - port: 9090
      protocol: TCP
  selector:
    app: prometheus-server
#kubectl apply -f prometheus.yaml -n keda-demo
-
访问http://ip:端口
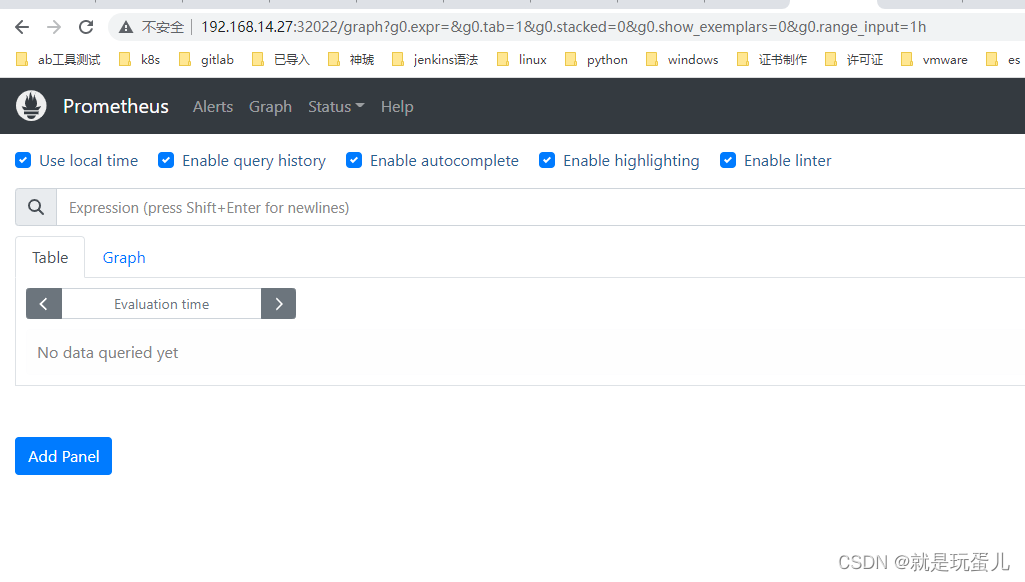
-
部署Keda
可以在github下载其他版本:
#kubectl apply -f https://github.com/kedacore/keda/releases/download/v2.4.0/keda-2.4.0.yaml
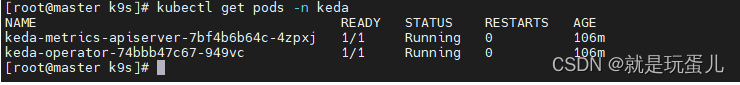
- 查看
metrics-apiserver将数据提供给Horizontal Pod Autoscaler(HPA),operator被deployment所使用。operator pod激活Kubernetes部署,实现向上和向下扩展。
#kubectl get pods -n keda
- 部署go程序
[root@master k9s]# cat deployment.yaml
apiVersion: apps/v1
kind: Deployment
metadata:
  name: go-prom-app
  namespace: keda-demo
spec:
  selector:
    matchLabels:
      app: go-prom-app
  template:
    metadata:
      labels:
        app: go-prom-app
    spec:
      containers:
        - name: go-prom-app
          image: djam97/keda:latest
          imagePullPolicy: IfNotPresent
          ports:
            - containerPort: 8080
---
apiVersion: v1
kind: Service
metadata:
  name: go-prom-app-service
  namespace: keda-demo
  labels:
    run: go-prom-app-service
spec:
  type: NodePort
  ports:
    - port: 8080
      protocol: TCP
  selector:
    app: go-prom-app
#kubectl apply -f deployment.yaml
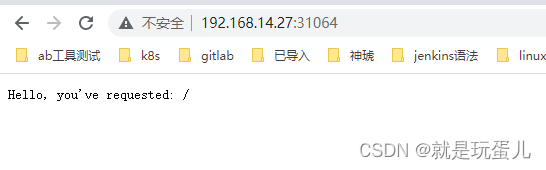
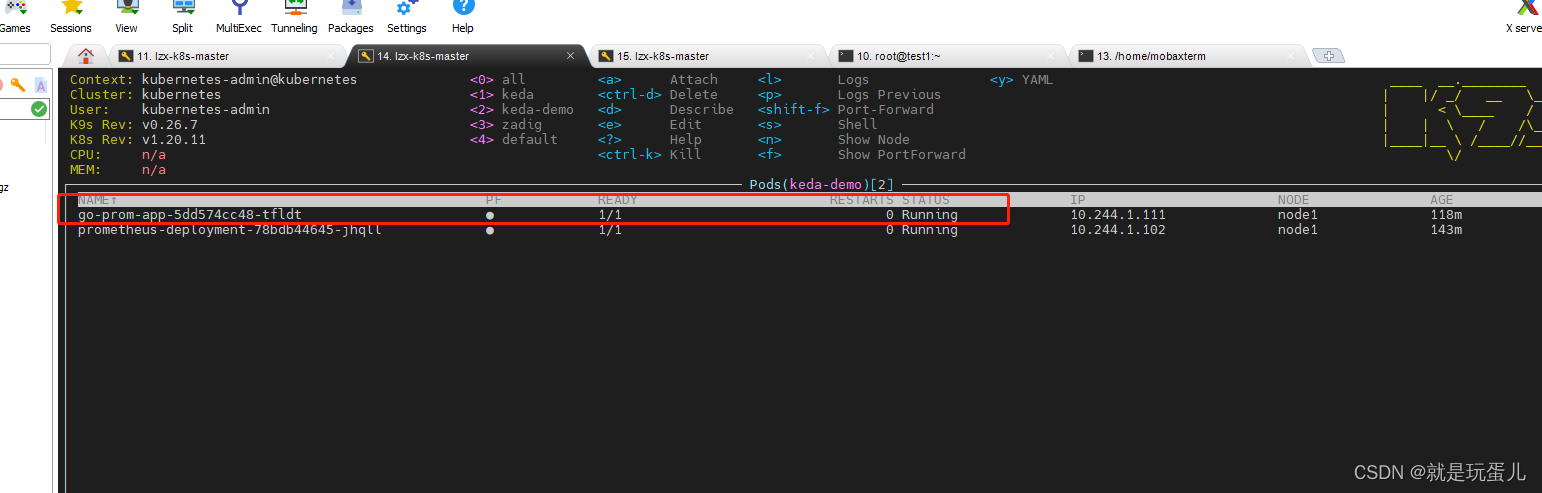
#kubectl get pod -n keda-demo
访问容器go服务:
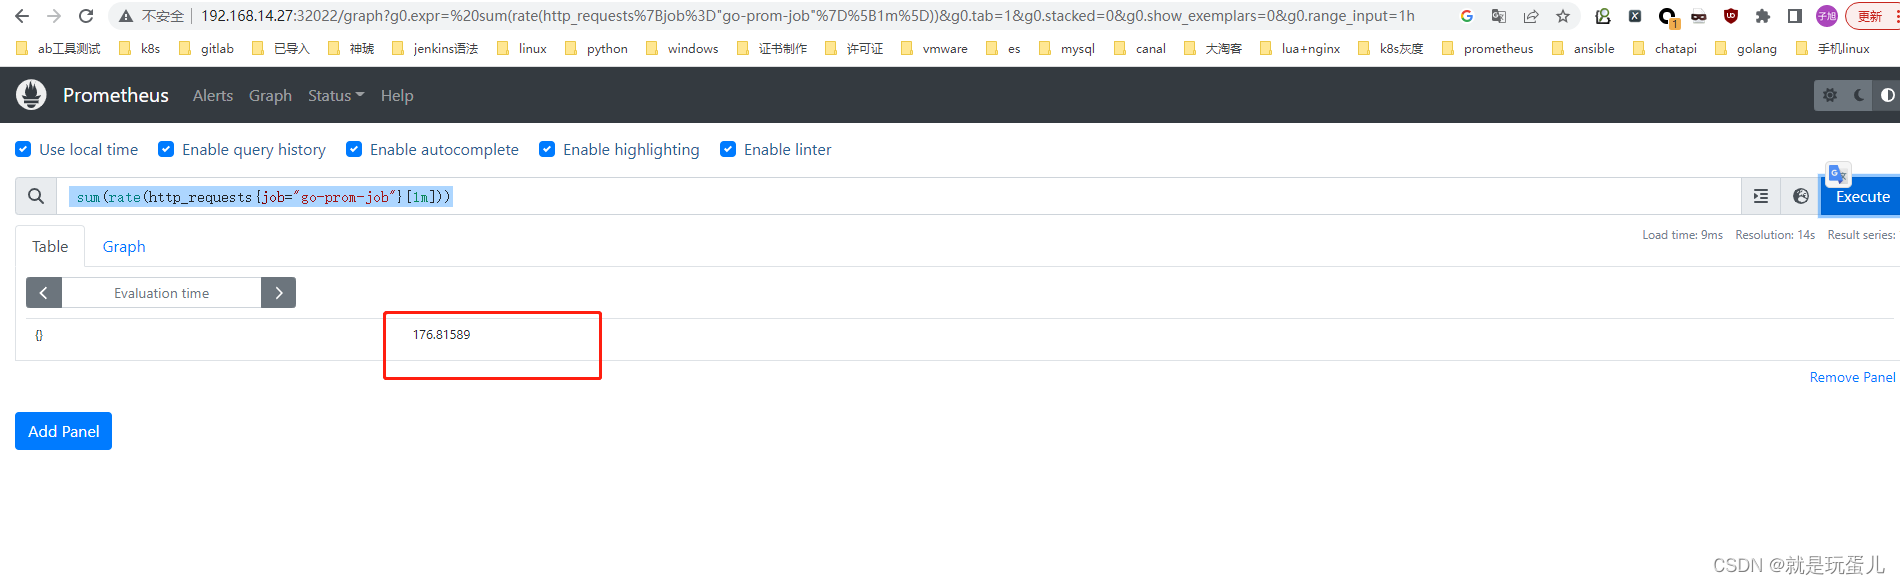
在prometheus上查看指标了,我们其实就是根据这个指标来做的伸缩。
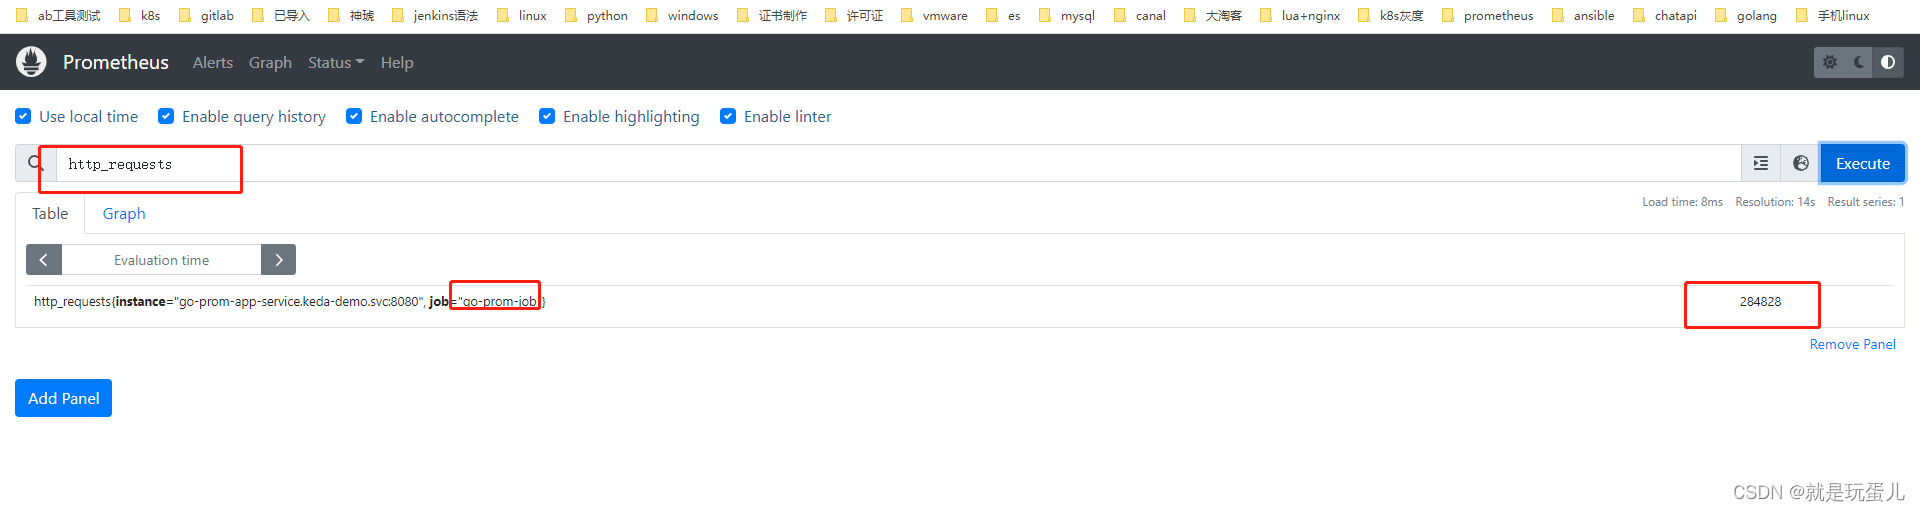
附加内容:djam97/keda镜像源码,如果你的其他的go项目也需要有http_requests指标,就需要如下加上,不然KEDA后面无法根据指标进行监控伸缩。
package main


import (
        "fmt"
        "log"
        "net/http"


        "github.com/prometheus/client_golang/prometheus"
        "github.com/prometheus/client_golang/prometheus/promhttp"
)


type Labels map[string]string


var (
        httpRequestsCounter = prometheus.NewCounter(prometheus.CounterOpts{


               Name: "http_requests",
               Help: "number of http requests",
        })
)


func init() {


        // Metrics have to be registered to be exposed:
        prometheus.MustRegister(httpRequestsCounter)
}


func main() {


        http.Handle("/metrics", promhttp.Handler())
        http.HandleFunc("/", func(w http.ResponseWriter, r *http.Request) {


               defer httpRequestsCounter.Inc()
               fmt.Fprintf(w, "Hello, you've requested: %s\n", r.URL.Path)
        })
        log.Fatal(http.ListenAndServe(":8080", nil))
}
- ScaledObject部署:
#cat scaled-object.yaml
[root@master k9s]# cat scaled-object.yaml
apiVersion: keda.sh/v1alpha1
# Custom CRD provisioned by the Keda operator
kind: ScaledObject
metadata:
name: prometheus-scaledobject
spec:
scaleTargetRef:
# target our deployment
#deployment的名字
name: go-prom-app
# Interval to when to query Prometheus
#探测时间间隔,默认30
pollingInterval: 5
# The period to wait after the last trigger reported active
# before scaling the deployment back to 1
#pod生存的时间可选. 默认: 300
cooldownPeriod: 30
# min replicas keda will scale to
# if you have an app that has an dependency on pubsub
# this would be a good use case to set it to zero
# why keep your app running if your topic has no messages?
#基础最小数量
minReplicaCount: 1
# max replicas keda will scale to
#限制最大数据量
maxReplicaCount: 20
#可选.扩容策略在advanced.horizontalPodAutoscalerConfig.scaleUp.policies中指定了50%,这意味着pod将按其当前pod数量的50%进行扩展。1 -> 2 -> 3 -> 5 -> 8 -> 12 -> 18 -> 20,扩展到20个Pod就停止。
advanced:
# HPA config
# Read about it here: https://kubernetes.io/docs/tasks/run-application/horizontal-pod-autoscale/
horizontalPodAutoscalerConfig:
behavior:
scaleDown:
stabilizationWindowSeconds: 30
policies:
- type: Percent
value: 50
periodSeconds: 30
scaleUp:
stabilizationWindowSeconds: 0
policies:
- type: Percent
value: 50
periodSeconds: 10
triggers:
- type: prometheus #支持rabbitmq, prometheus,Kafka,mysql,PostgreSQL等等
metadata:
# address where keda can reach our prometheus on
#serverAddress: http://prometheus-service.keda-demo.svc.cluster.local:9090
#prometheus地址
serverAddress: http://192.168.14.27:32022
# metric on what we want to scale
#metic名字可以随便取
metricName: http_requests_test
# if treshold is reached then Keda will scale our deployment
#query值的大于100就执行hpa
threshold: "100"
#query语句,一分钟内的请求数大于100触发
query: sum(rate(http_requests{
job="go-prom-job"}[1m]))
# kubectl apply -f scaled-object.yaml -n keda-demo
#kubectl  get  svc -n keda-demo
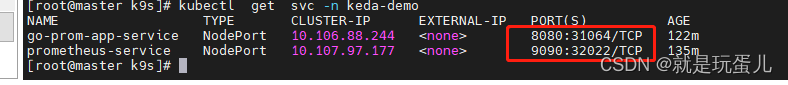
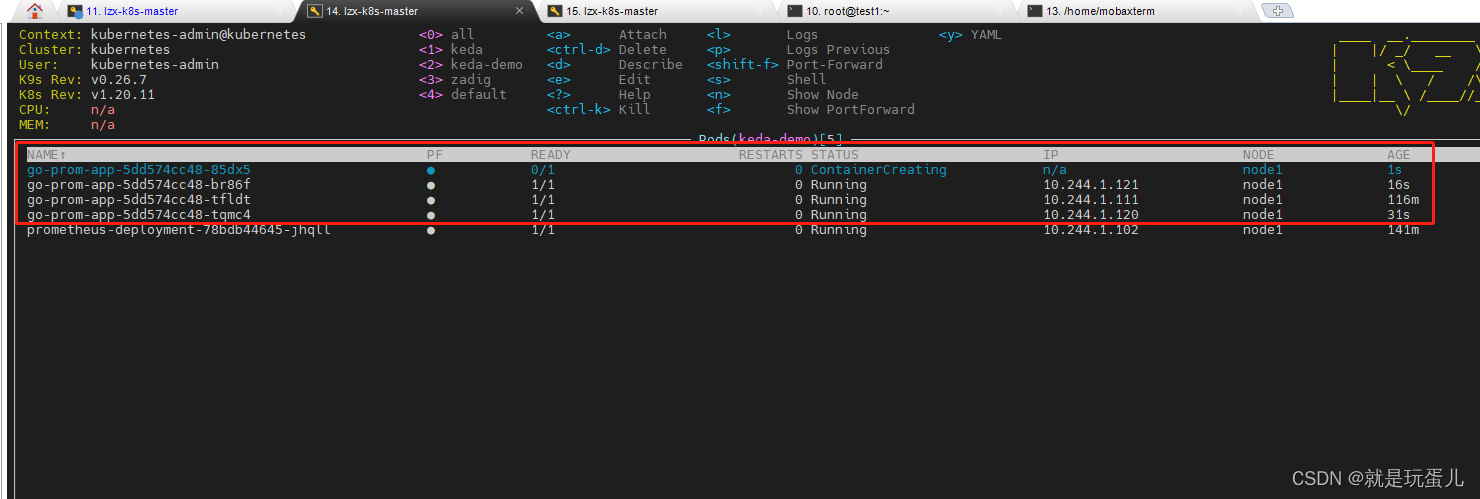
- 测试当请求数1分钟大于100是否自动扩容:
安装hey:
#wget https://hey-release.s3.us-east-2.amazonaws.com/hey_linux_amd64
#chmod +x hey_linux_amd64
#mv hey_linux_amd64 /usr/bin/hey
#hey -n 10000 -m GET http://192.168.14.27:31064/
#for i in {1..100};do sleep 2; hey -n 1000 -m GET http://192.168.14.27:31064/;done
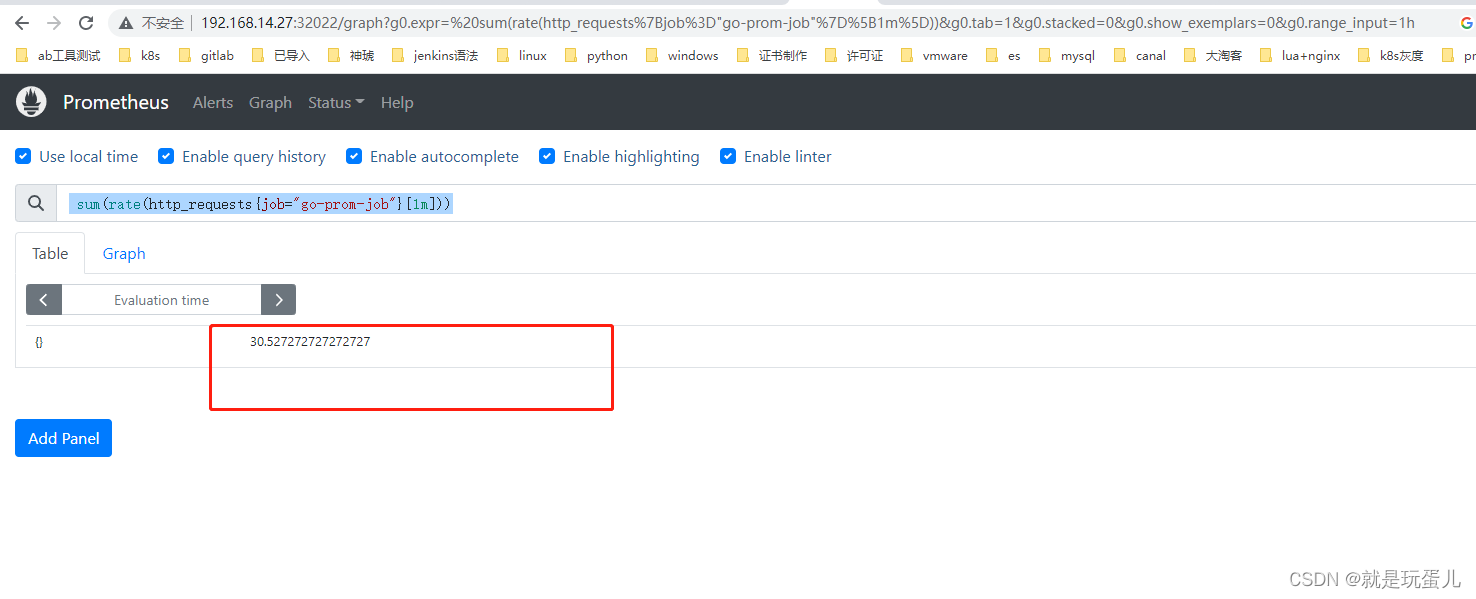
停止访问,看容器是否自动缩容到1:
小注意:ScaledObject 必须要和go-deployment在一个名称空间,不然无效。ScaledObject 找不到它