R语言的优势在于批量处理,常使用到循环和函数,三线表是科研文章中必备的内容。利用函数实现自动判断数据类型和计算。使用R包(table1)。
# 创建连续性变量
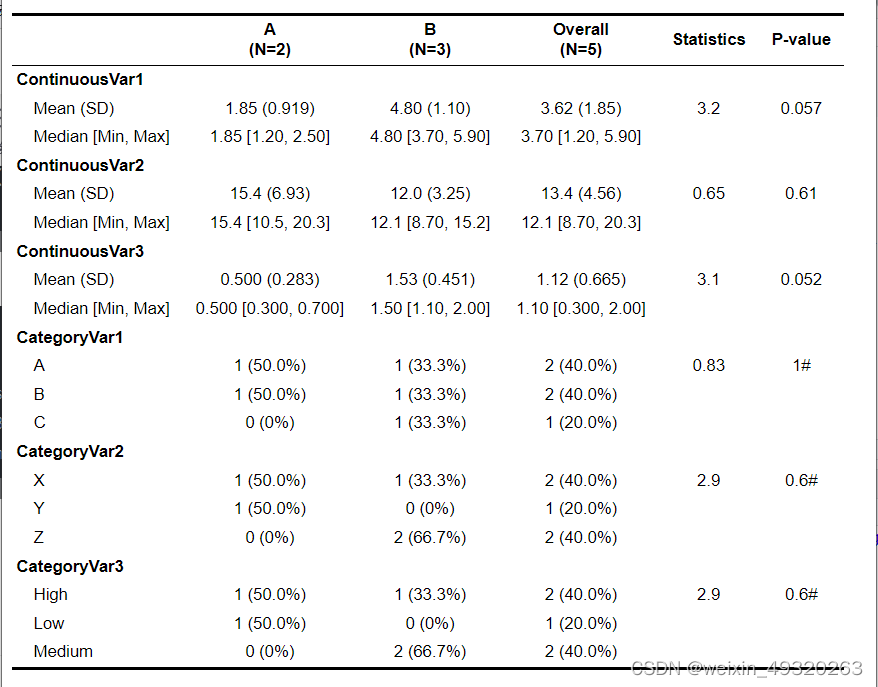
continuous_var1 <- c(1.2, 2.5, 3.7, 4.8, 5.9)
continuous_var2 <- c(10.5, 20.3, 15.2, 8.7, 12.1)
continuous_var3 <- c(0.3, 0.7, 1.1, 2.0, 1.5)
# 创建分类变量
category_var1 <- factor(c("A", "B", "A", "C", "B"))
category_var2 <- factor(c("X", "Y", "Z", "X", "Z"))
category_var3 <- factor(c("High", "Low", "Medium", "Medium", "High"))
# 创建data.frame
df <- data.frame(
ContinuousVar1 = continuous_var1,
ContinuousVar2 = continuous_var2,
ContinuousVar3 = continuous_var3,
CategoryVar1 = category_var1,
CategoryVar2 = category_var2,
CategoryVar3 = category_var3
)
# 显示data.frame
df#generate three line table
#pvalue
pvalue <- function(x, name, ...){
y <- df[[name]]#variable
g <- df[,"Group"]#Group
if (is.numeric(y)) {
if (shapiro.test(y)$p.value>0.05){
p <- t.test(y ~ g)$p.value
p_with_symbol <- paste0(format.pval(p, digits = 3, eps = 0.001), "*")
}else{
p <- wilcox.test(y ~ g)$p.value
p_with_symbol <- paste0(format.pval(p, digits = 3, eps = 0.001), "**")
}
}else{
if (length(y) > 40 & any(sapply(chisq.test(y,g)$expected, function(x) x >=1))){
p <- chisq.test(y, g)$p.value
p_with_symbol <- paste0(format.pval(p, digits = 3, eps = 0.001,trim = FALSE), "#")
} else {
p<-fisher.test(y,g)$p.value
p_with_symbol <- paste0(format.pval(p, digits = 3, eps = 0.001), "##")
}
}
c("", p_with_symbol)
}
#自定义函数准备显示统计值(t值或卡方值)
stat_value <- function(x, name, ...) {
y <- df[[name]] # 变量
g <- df[,"Group"] # 分组变量
if (is.numeric(y)) {
# 连续变量使用 t 检验或 Mann-Whitney U 测试
if (shapiro.test(y)$p.value > 0.05) {
s <- abs(t.test(y ~ g)$statistic[["t"]]) # 正态分布,使用 t 检验
} else {
s <- wilcox.test(y ~ g)[["statistic"]][["W"]] # 非正态分布,使用 Mann-Whitney U 测试
}
} else {
if(length(y) > 40 & any(sapply(chisq.test(y,g)$expected, function(x) x >=1))){
s<-chisq.test(y, g)$statistic[["X-squared"]]
} else {
s<-fisher.test(y, g)$statistic[["X-squared"]]
}
# 分类变量使用卡方检验
s <- chisq.test(y, g)$statistic[["X-squared"]]
}
c("", format.pval(s, digits=3, eps=0.001))
}
#定义变量的展现形式
# rndr <- function(x, name, ...) {
# if (!is.numeric(x)) return(render.categorical.default(x))
# what <- switch(name,
# Age = "Median [Min, Max]",
# `Survival months` = "Median [Min, Max]"
# )
# parse.abbrev.render.code(c("", what))(x)
# }#绘图
library(table1)
paste(sprintf("`%s`",colnames(df)),collapse="+")
df$Group<-c(rep("A",2),rep("B",3))
table<-table1(~`ContinuousVar1`+`ContinuousVar2`+`ContinuousVar3`+`CategoryVar1`+`CategoryVar2`+`CategoryVar3`|Group,ender=rndr,data=df,extra.col=list(`Statistics`=stat_value,`P-value`=pvalue))
#保存为docx
library(flextable);help(package="flextable")
table_fl<-t1flex(table)
save_as_docx(table_fl,path="table.docx")